
Bot & Ad Fraud Statistics
Fraudlogix provides ongoing research to enhance the global effort to stop bots. Share StatsContact Us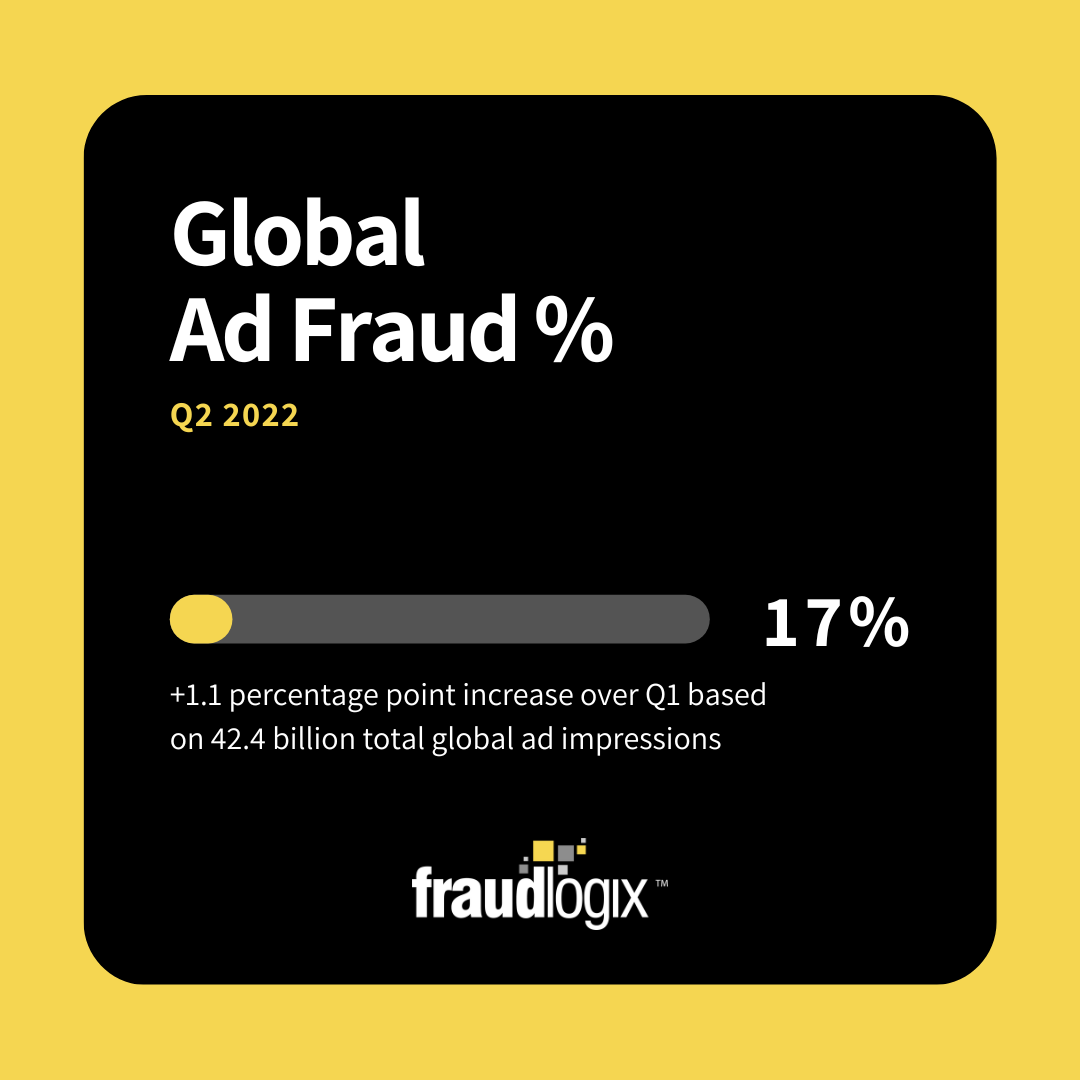
Global Ad Fraud %
The current fraud percentage of ad impressions globally
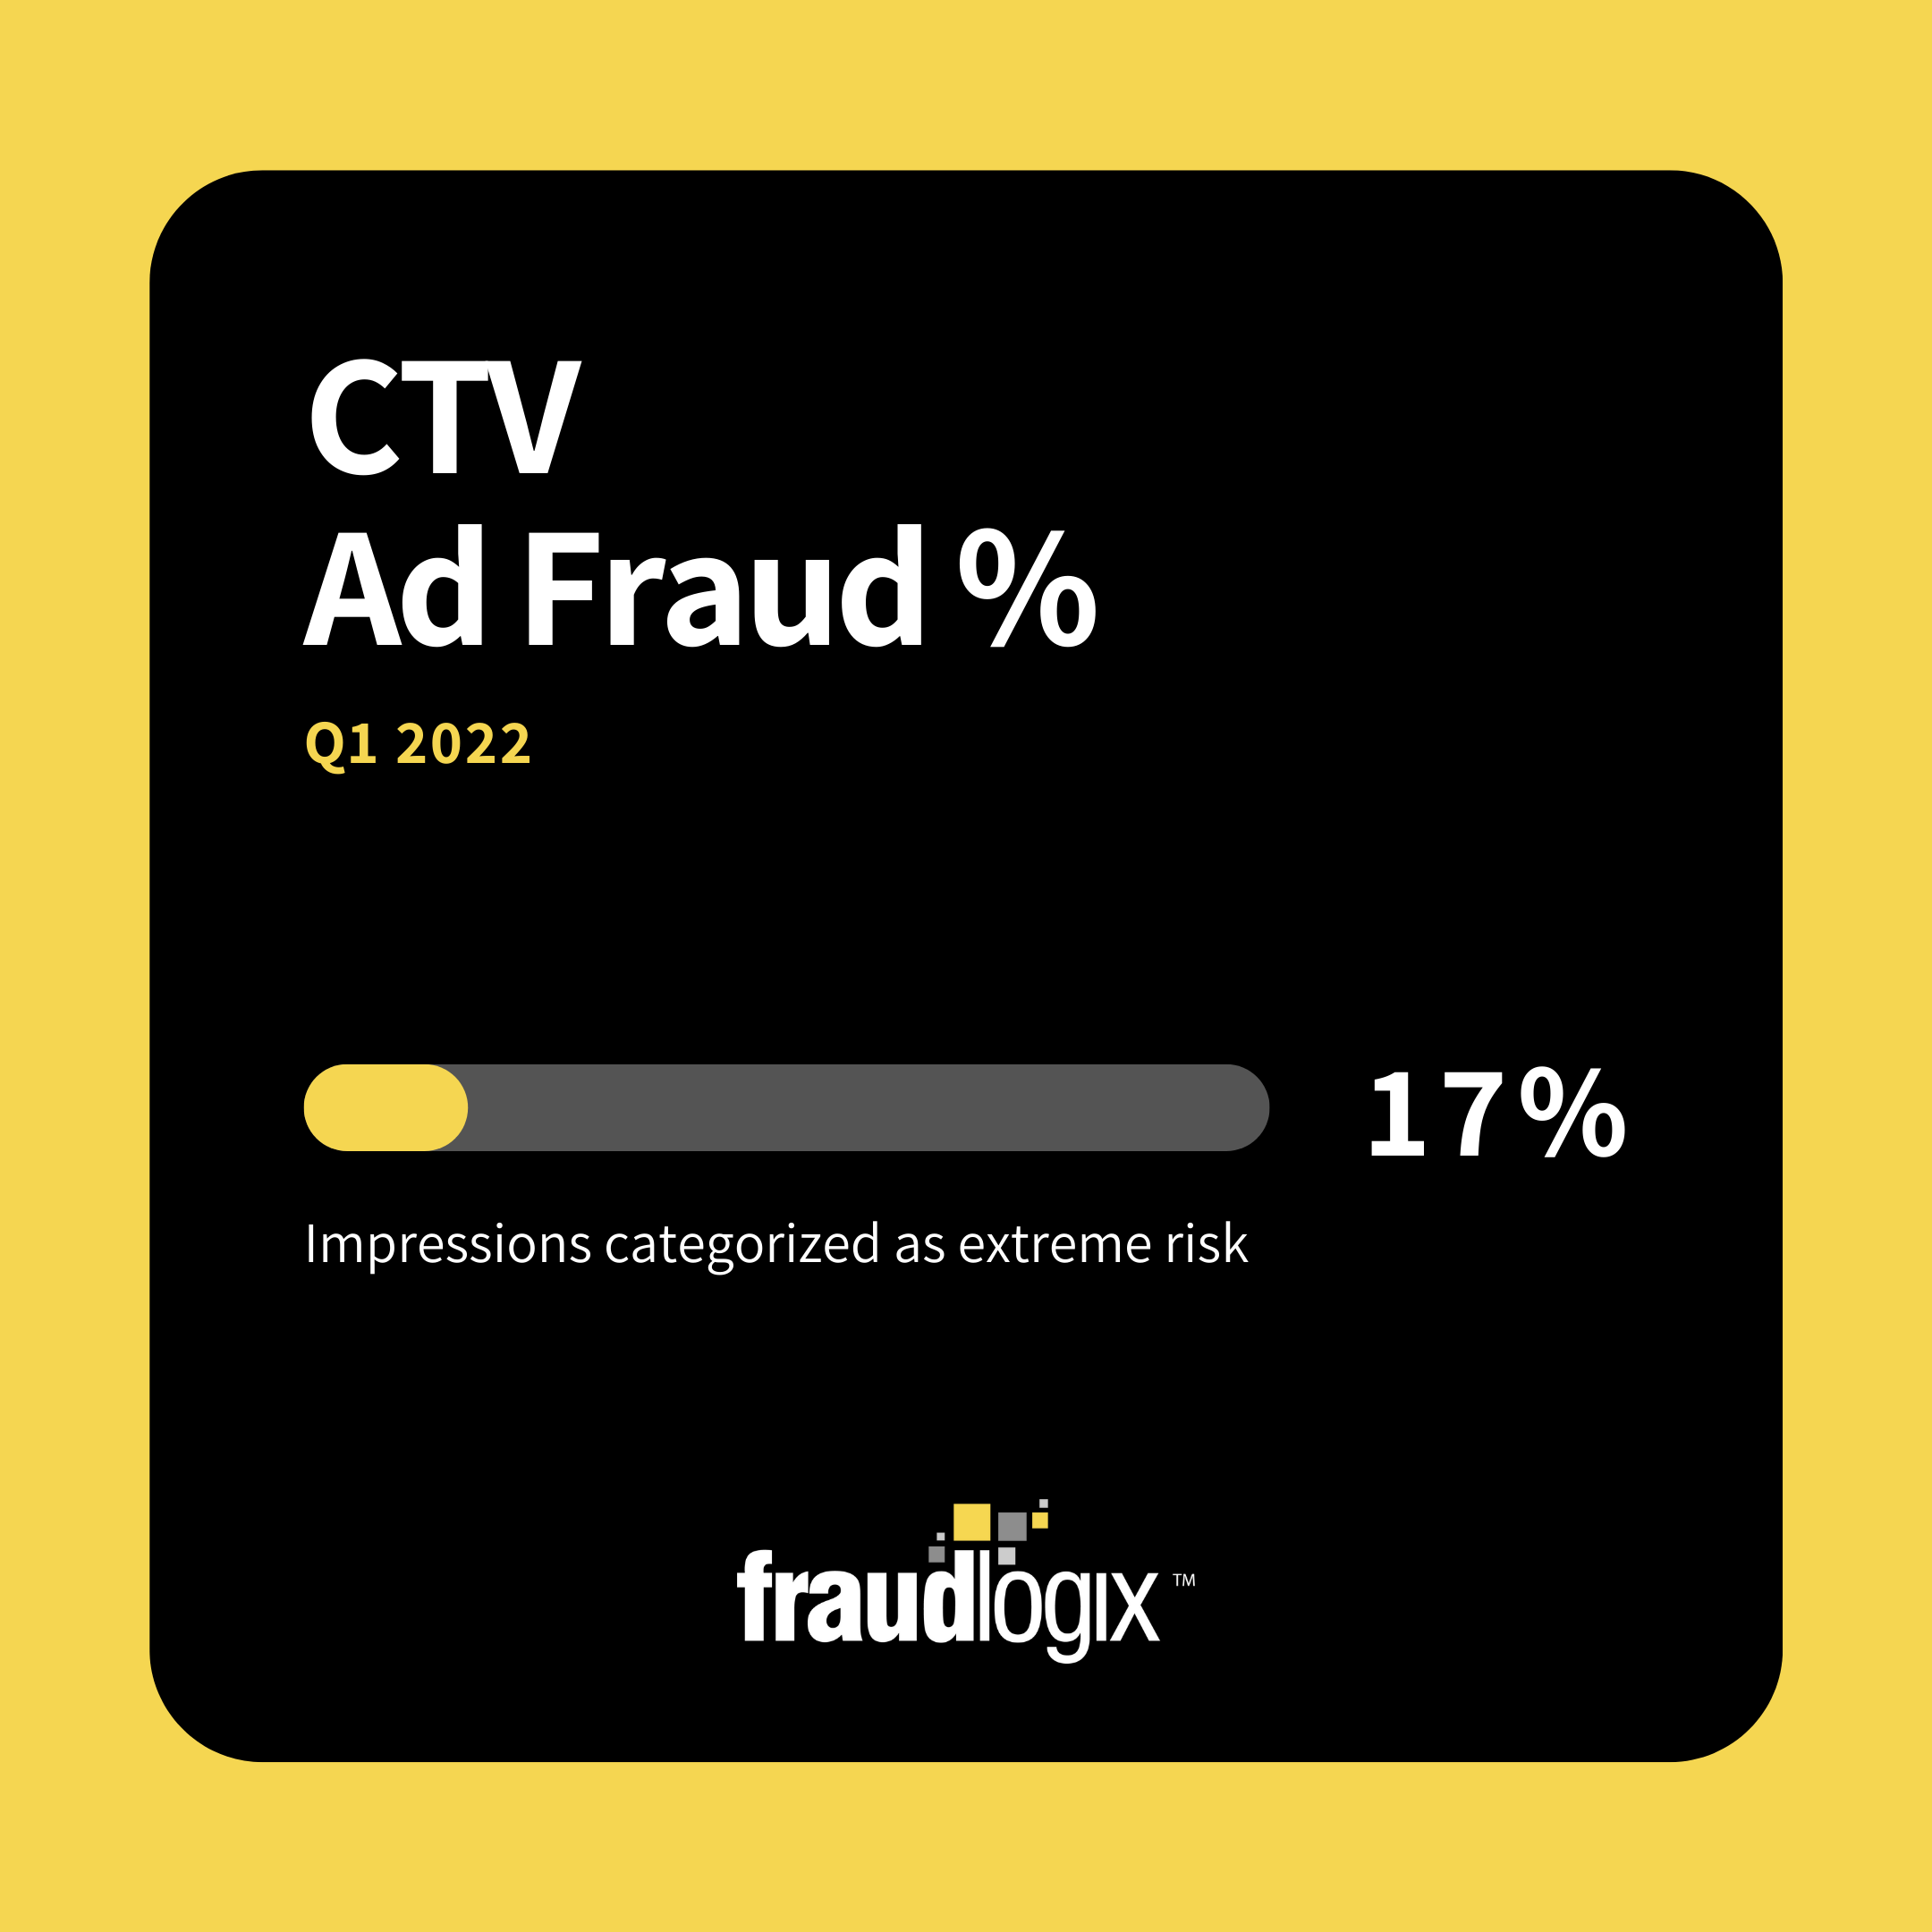
CTV Ad Fraud %
Connected TV advertising impressions categorized as extreme risk
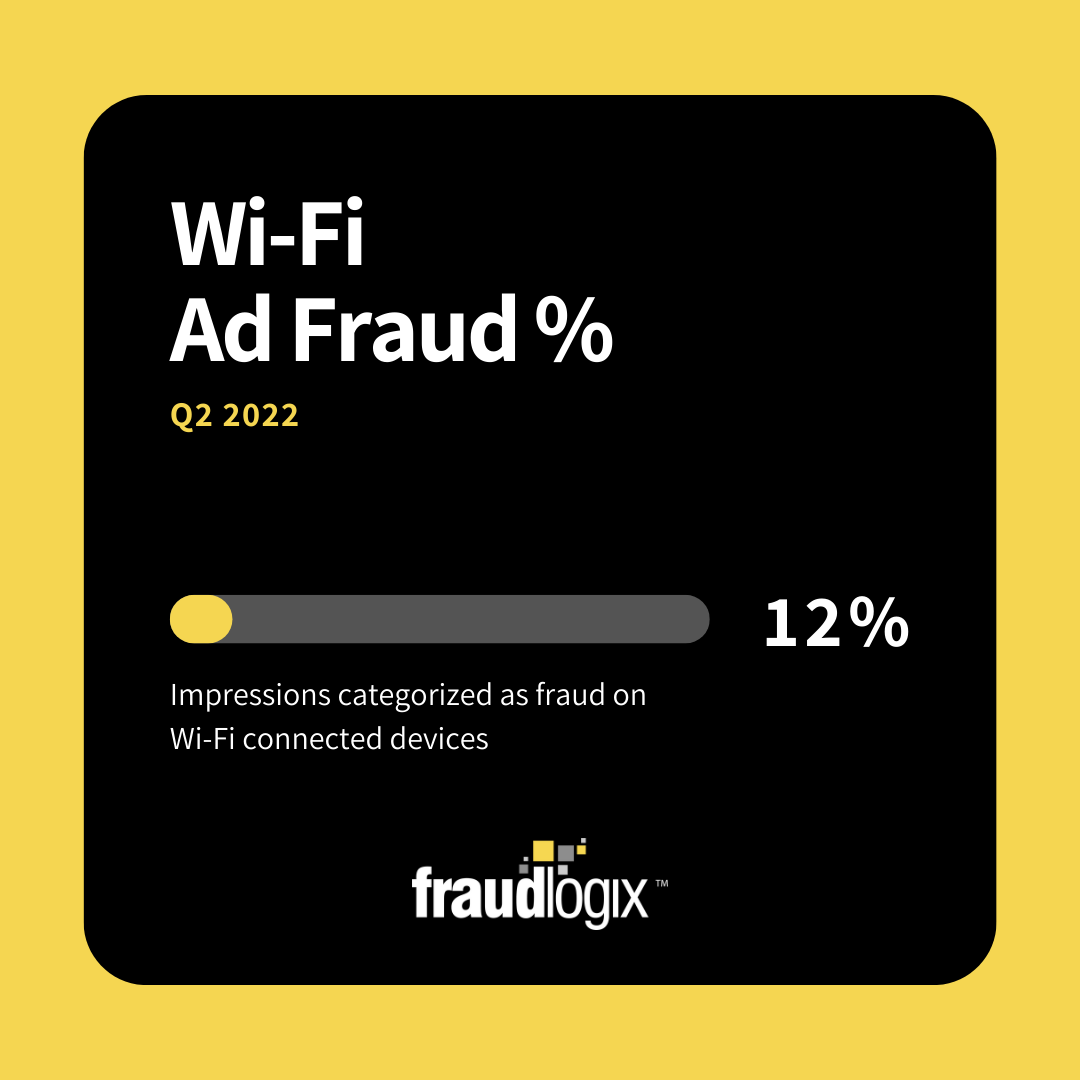
Ad Fraud % on WiFi
Impressions categorized as fraud on Wi-Fi connected devices
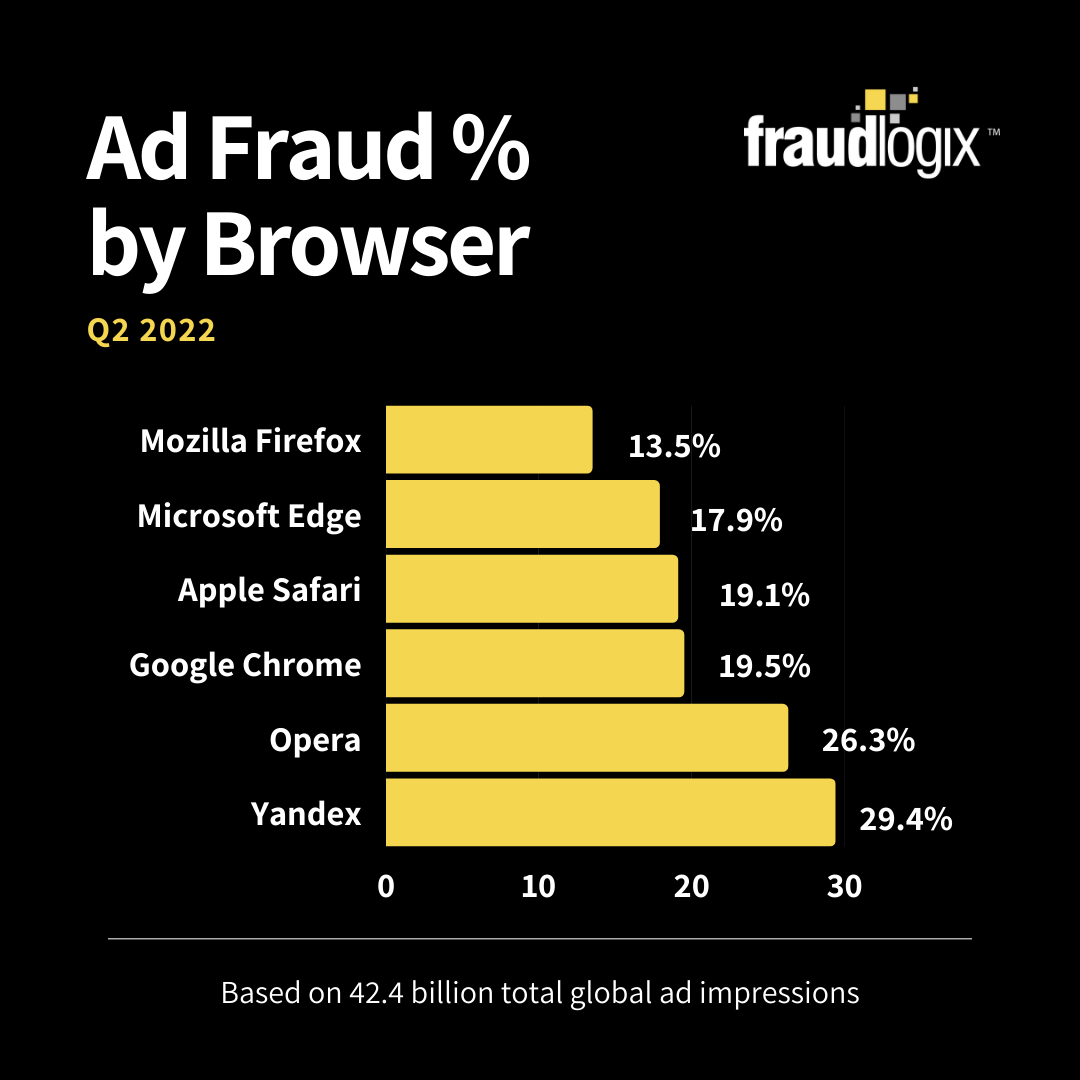
Ad Fraud % by Browser
Impressions categorized as bots and ad fraud for each major browser
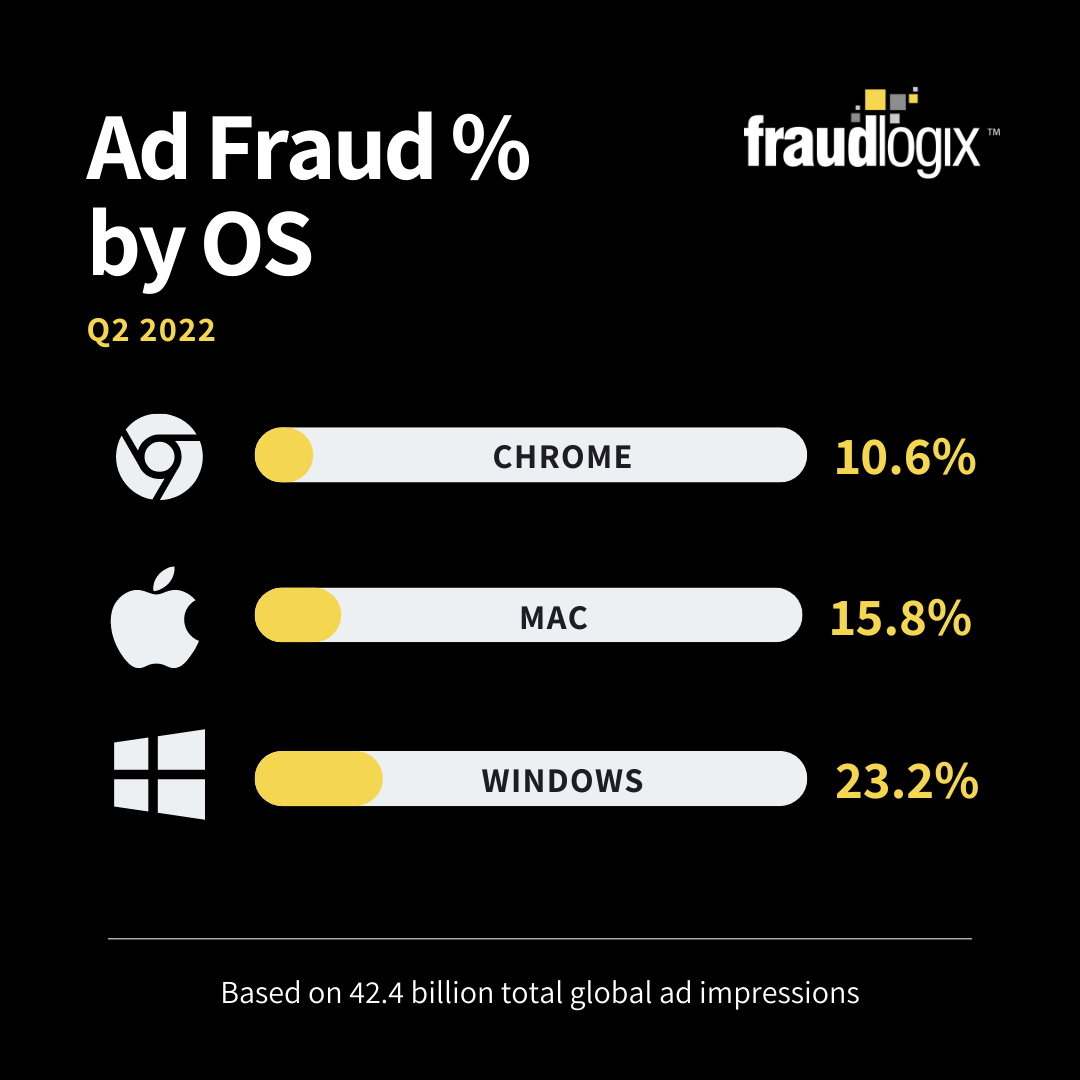
Ad Fraud % by Operating System
Impressions categorized as bots and ad fraud on Chrome, Mac, and Windows
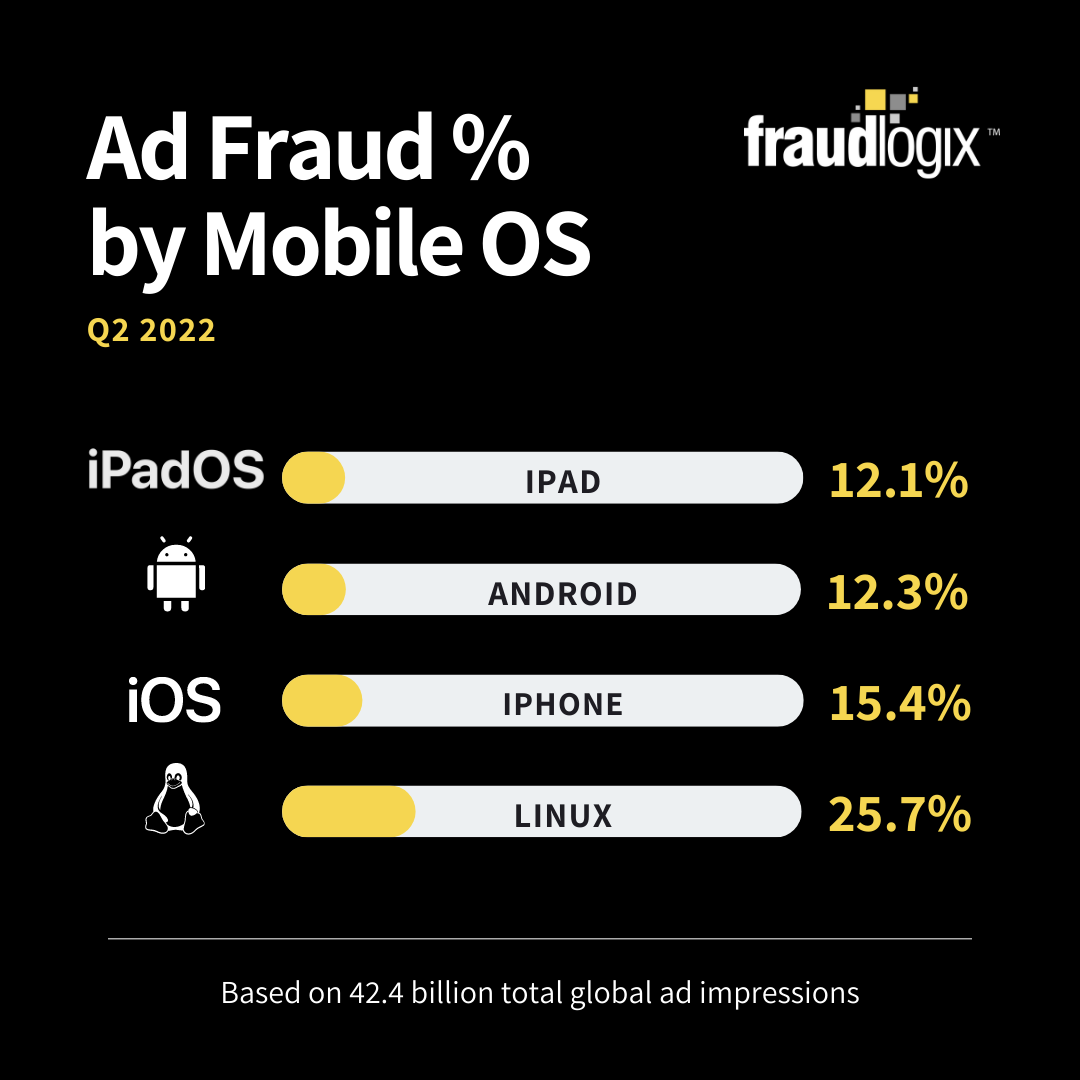
Ad Fraud % by Mobile OS
Mobile operating system impressions categorized as bots and ad fraud
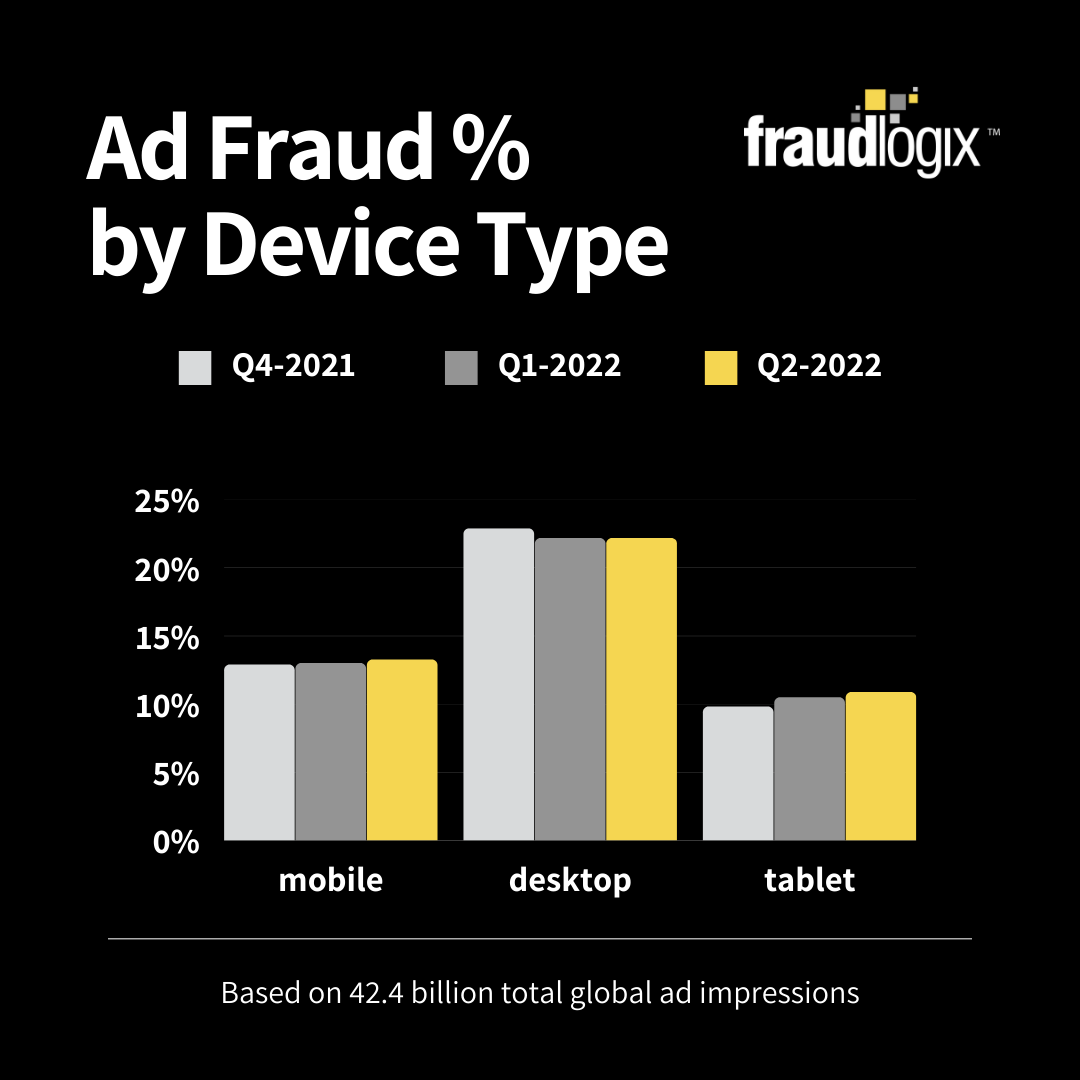
Ad Fraud % by Device Type
Impressions categorized as bots and ad fraud on mobile, desktop, and tablet
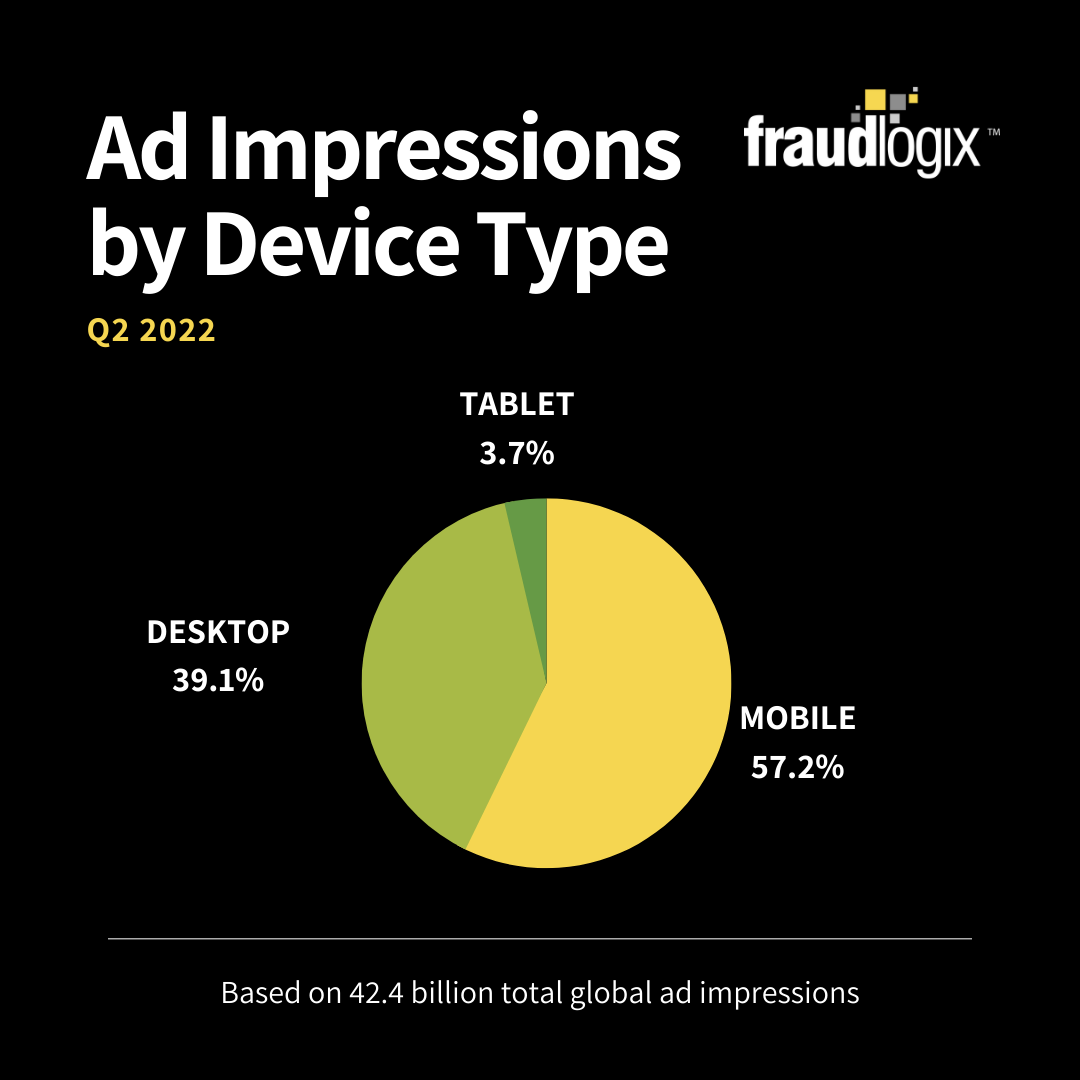
Ad Impressions by Device Type
Total impressions for each device type: mobile, desktop, and tablet
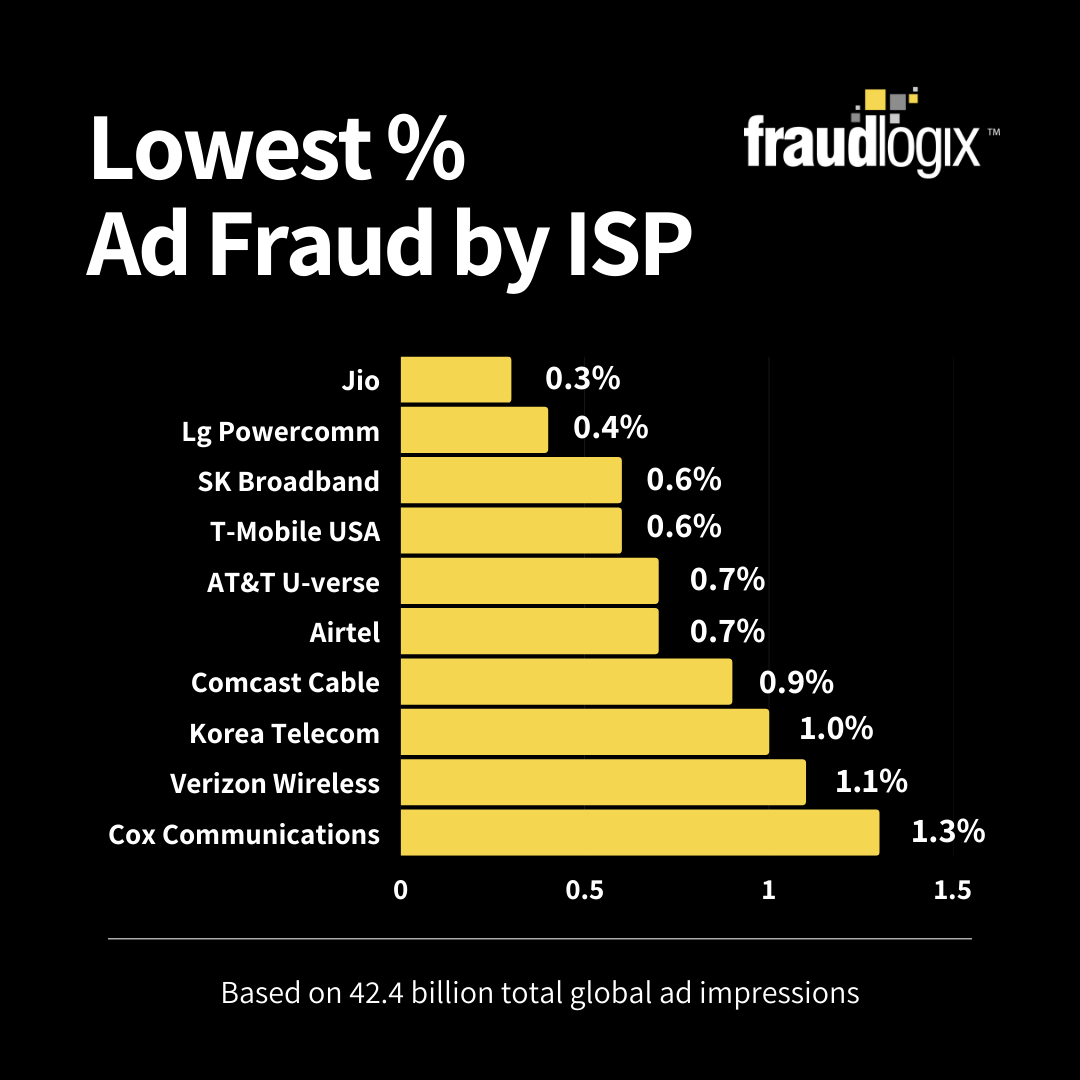
Lowest % Ad Fraud by ISP
Impressions categorized as bots and ad fraud among internet service providers
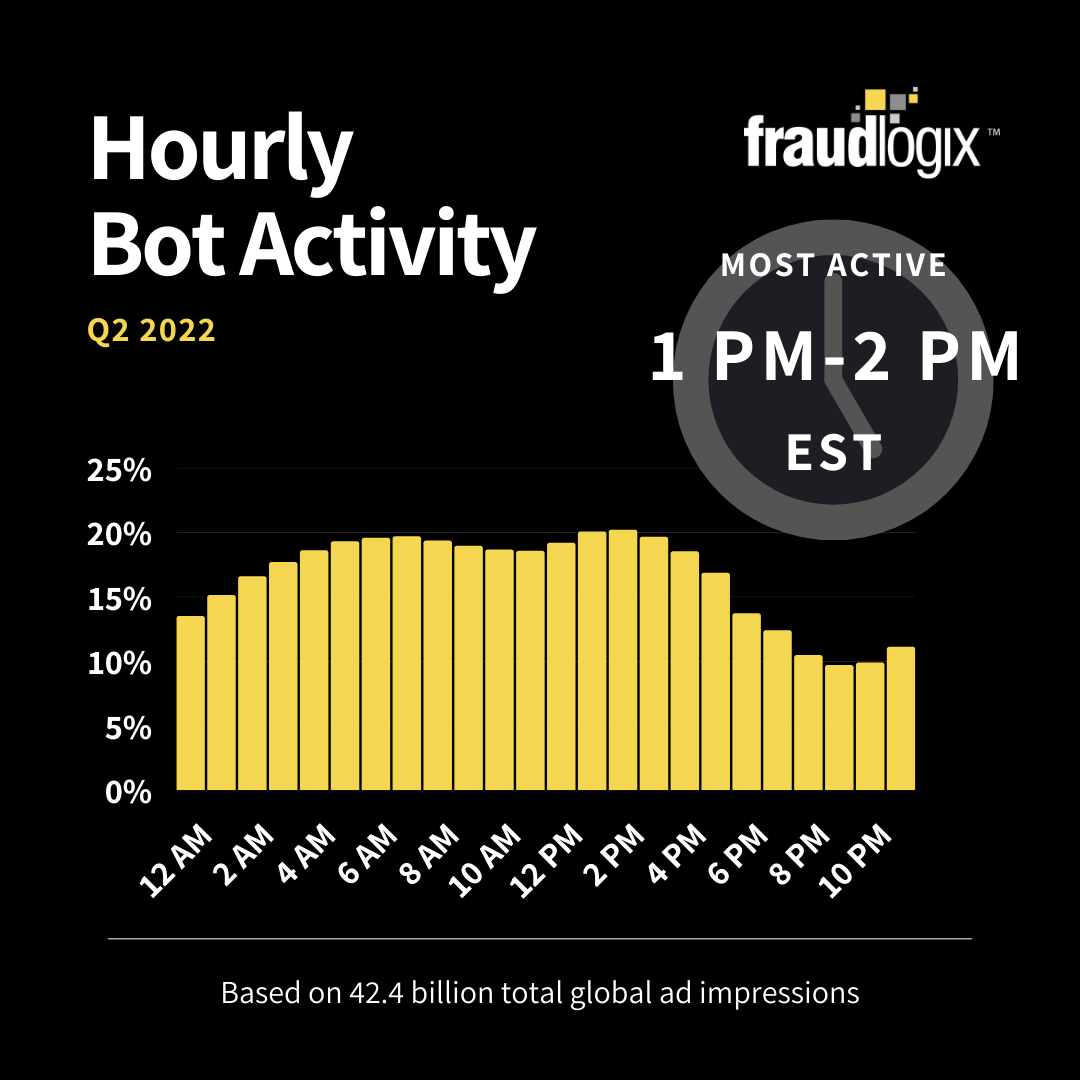
Hourly Bot Activity
U.S. impressions categorized as bots and ad fraud for each hour of the day
Ad Fraud in the U.S.
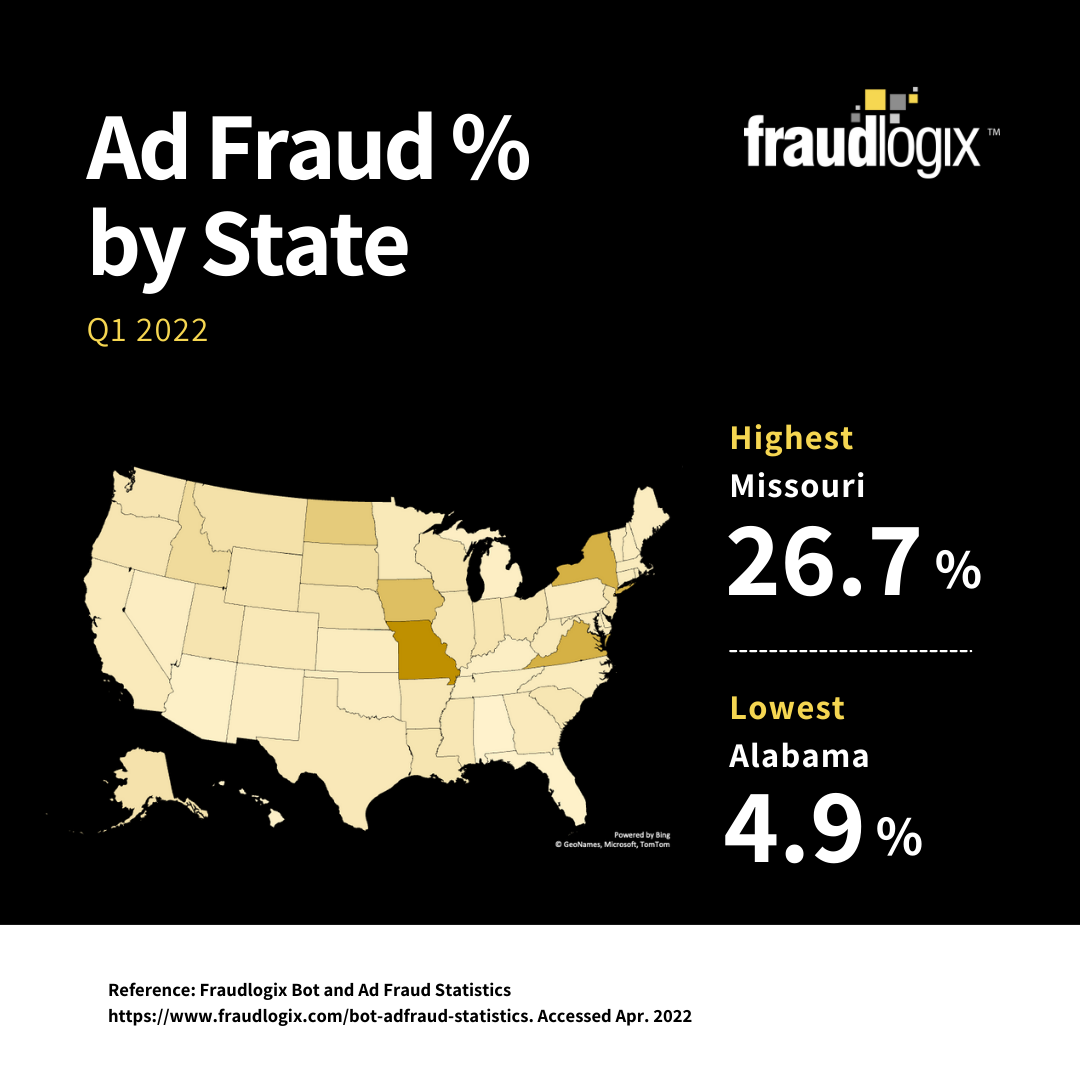
Ad Fraud % by State
States with the highest and lowest bot and ad fraud traffic
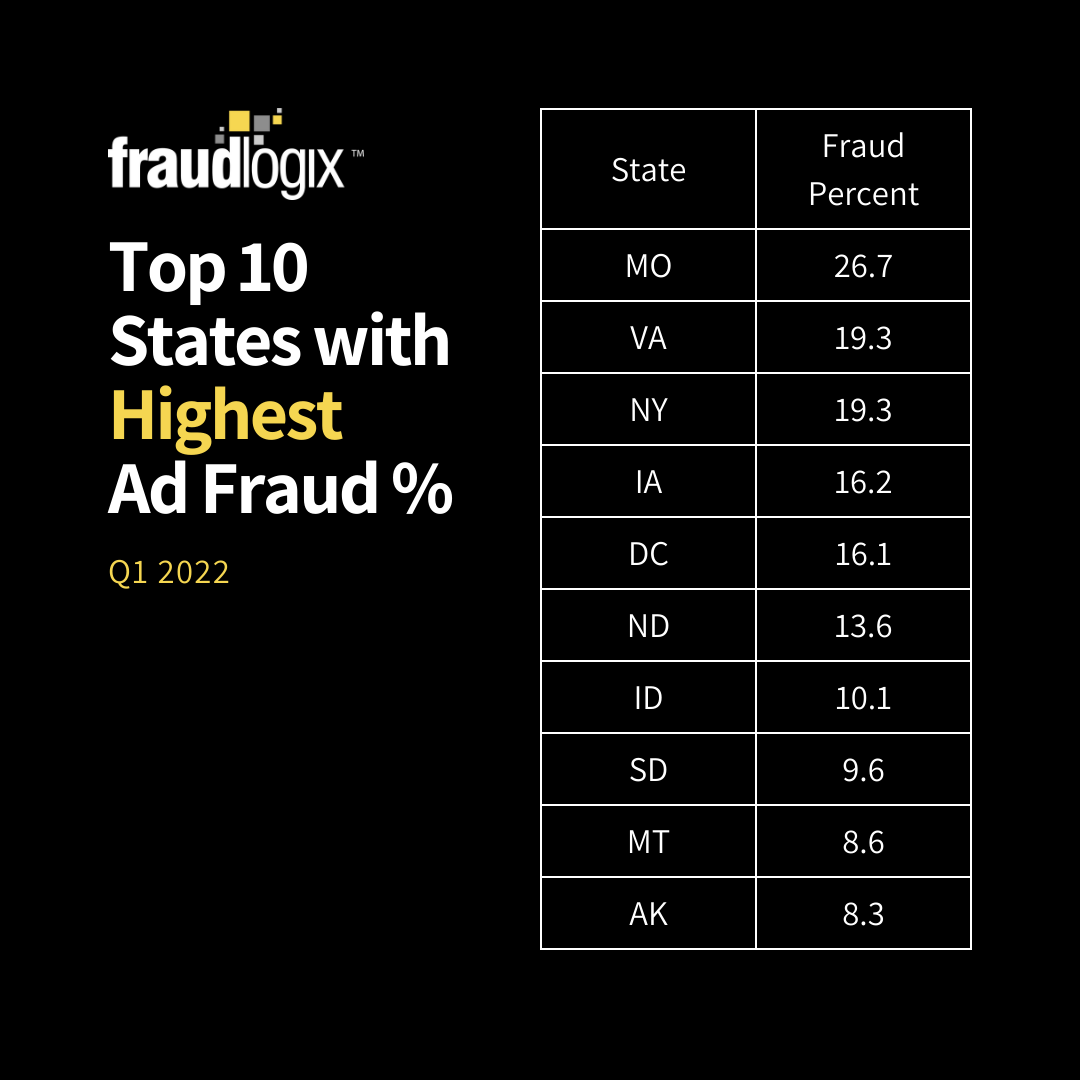
States with Highest % Bot Traffic
Impressions categorized as bots and ad fraud for states with highest percentage
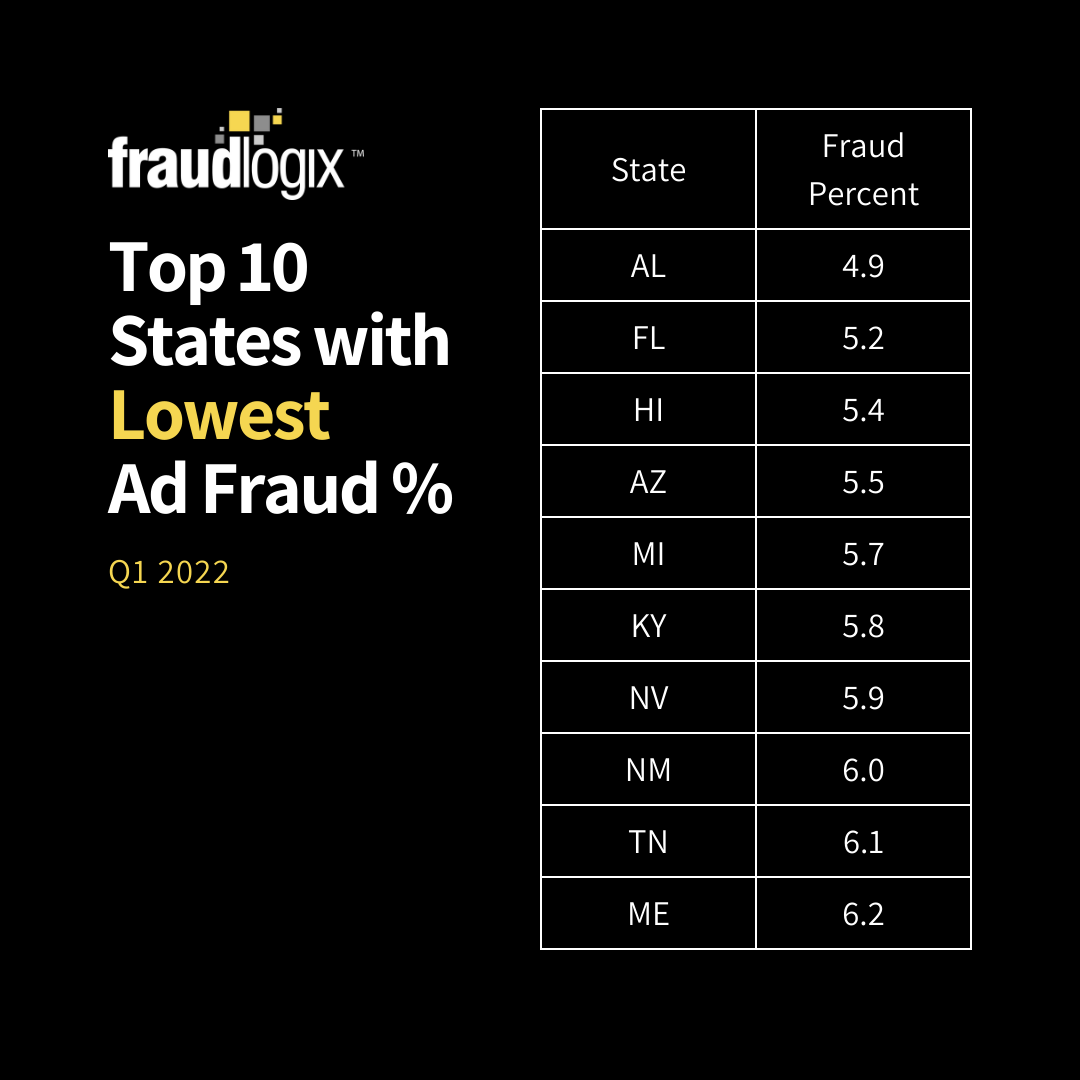
States with Lowest % Bot Traffic
Impressions categorized as bots and ad fraud for states with lowest percentage
Bot Traffic by Country
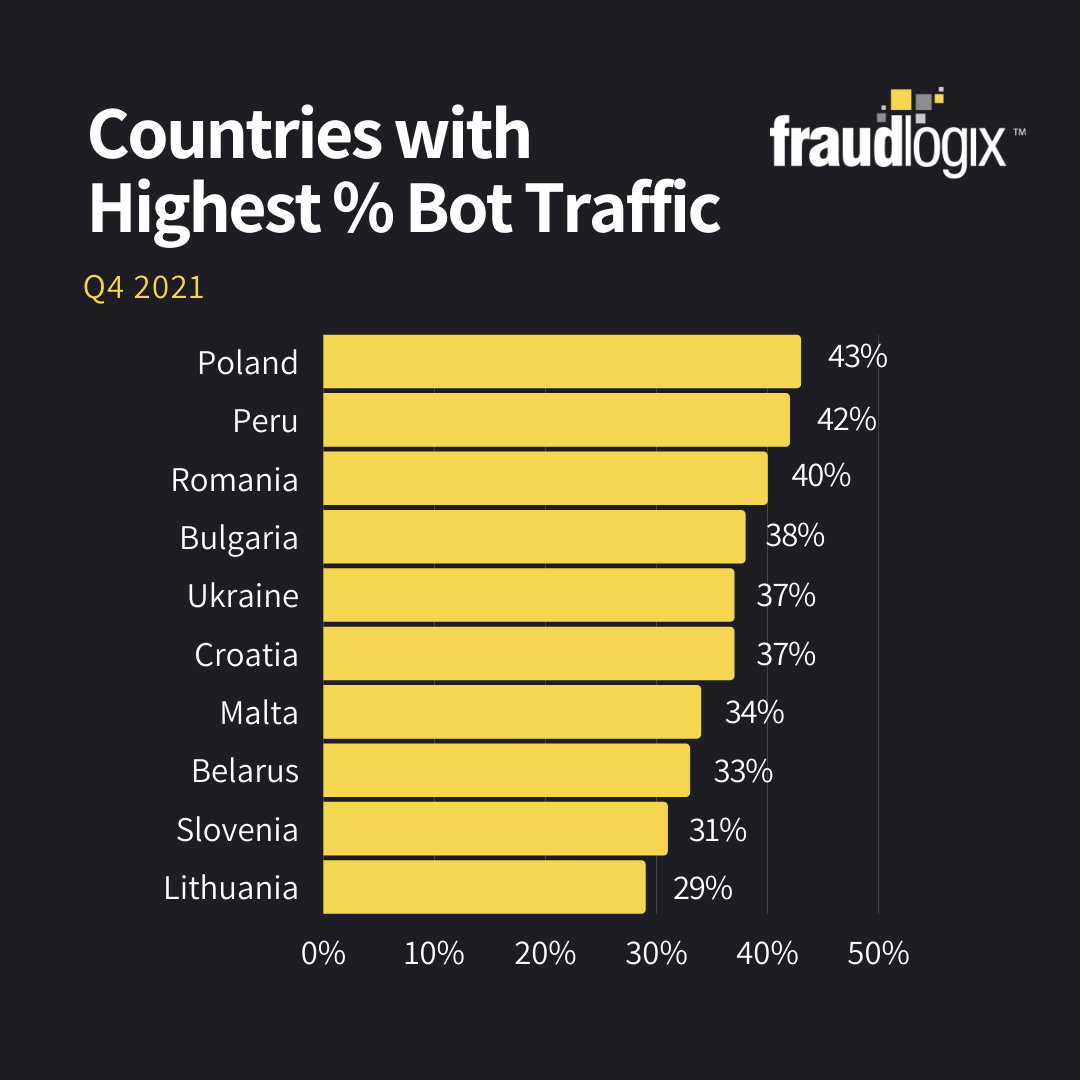
Countries with Highest % Bots
Impressions categorized as bots and ad fraud for countries with highest percentage
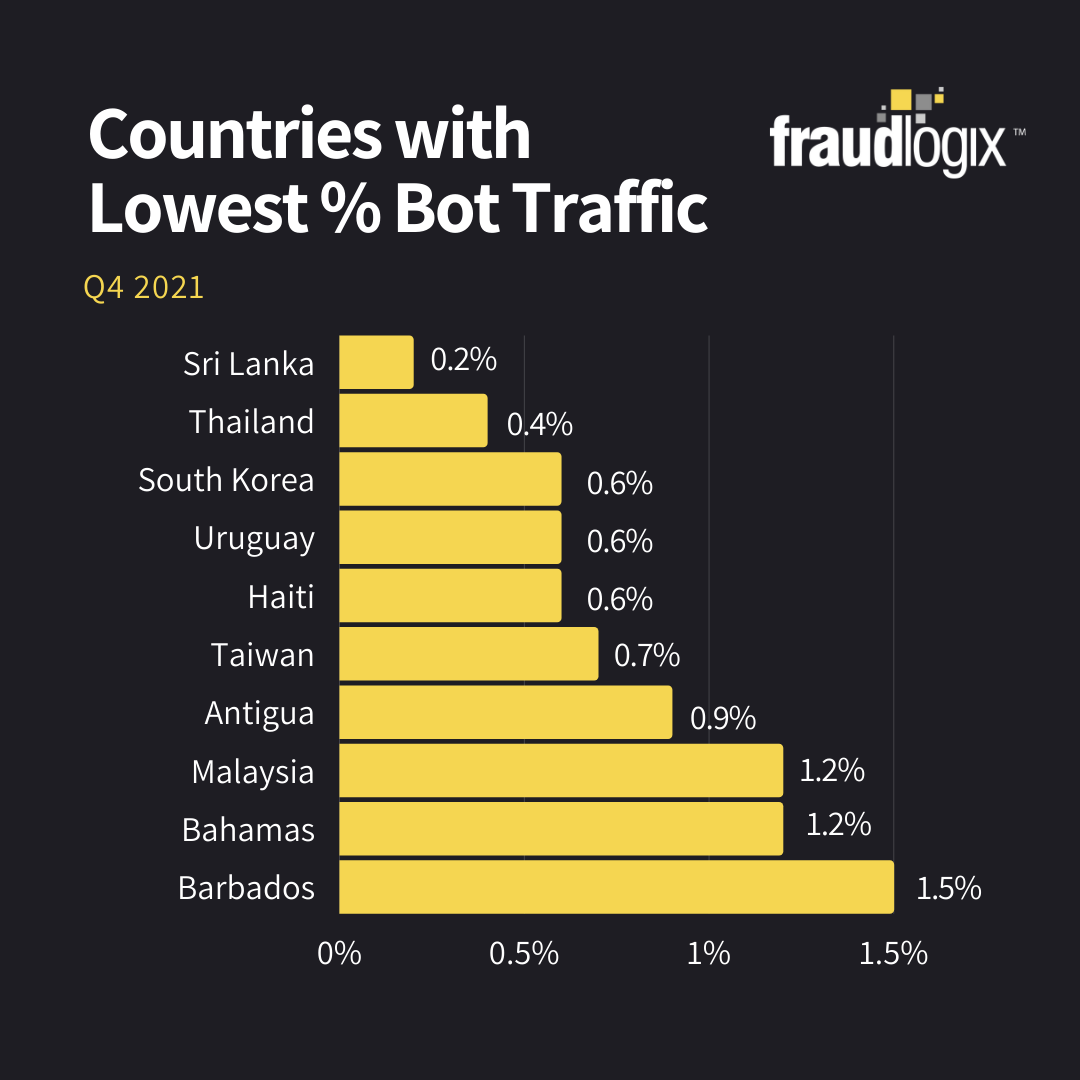
Countries with Lowest % Bots
Impressions categorized as bots and ad fraud for states with lowest percentage
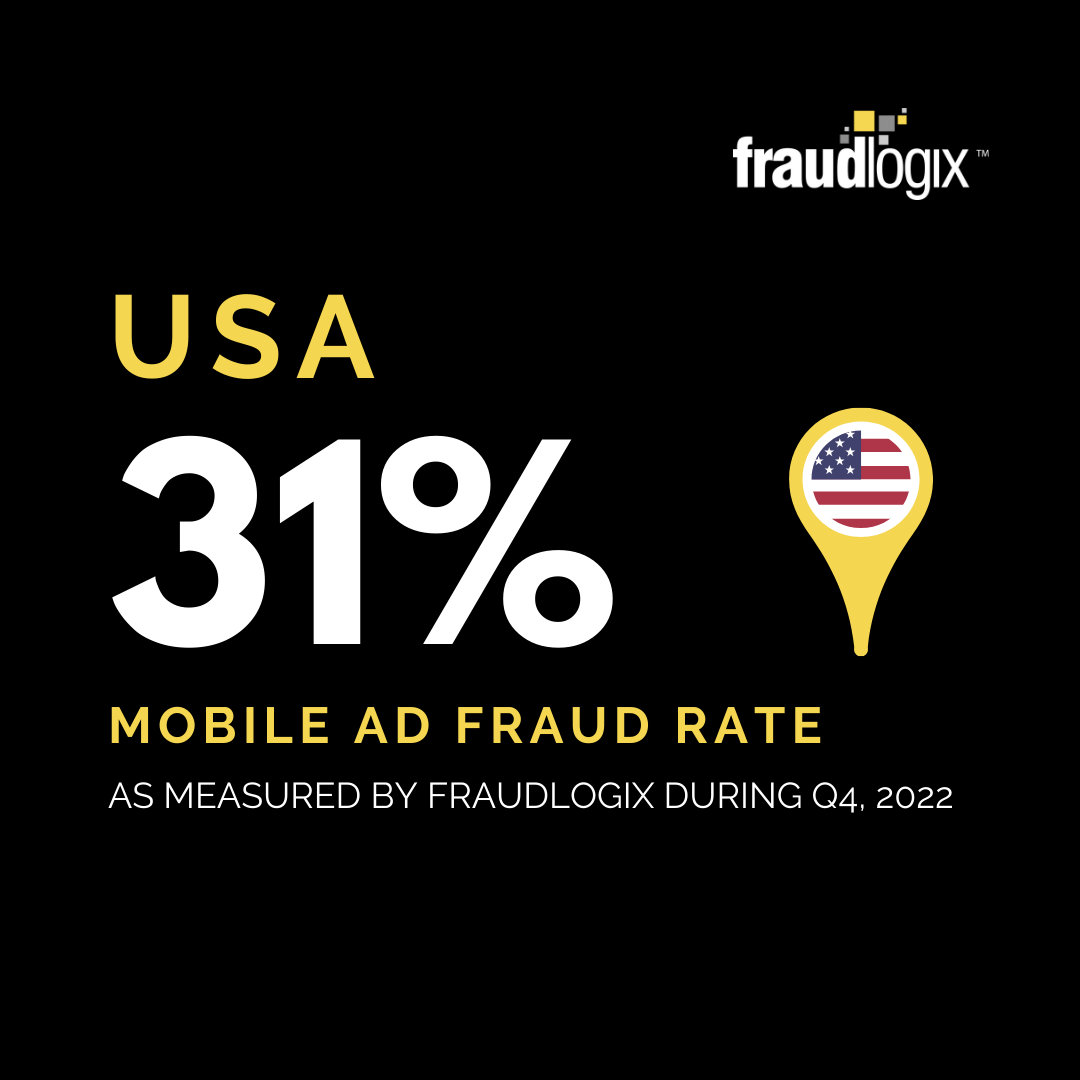
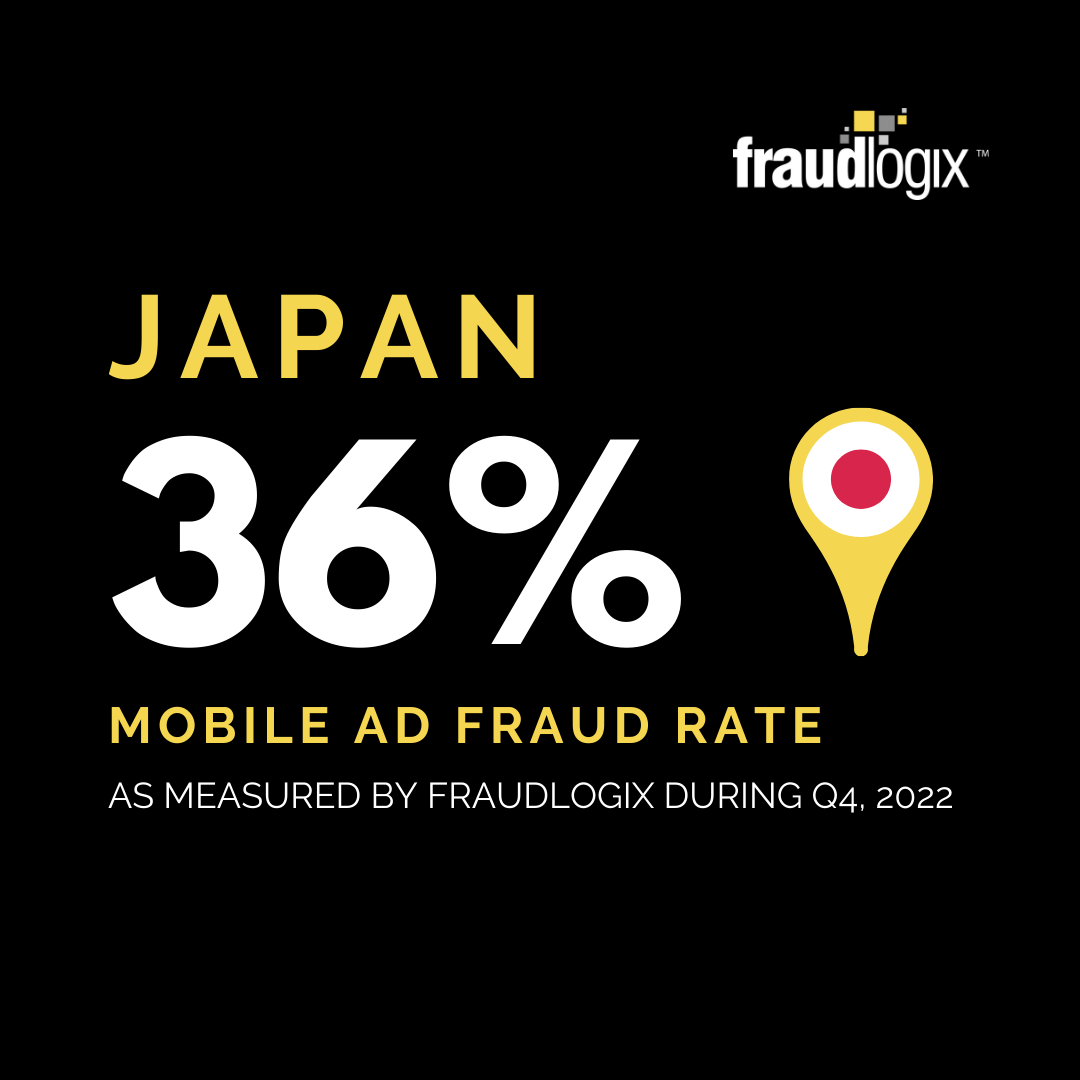
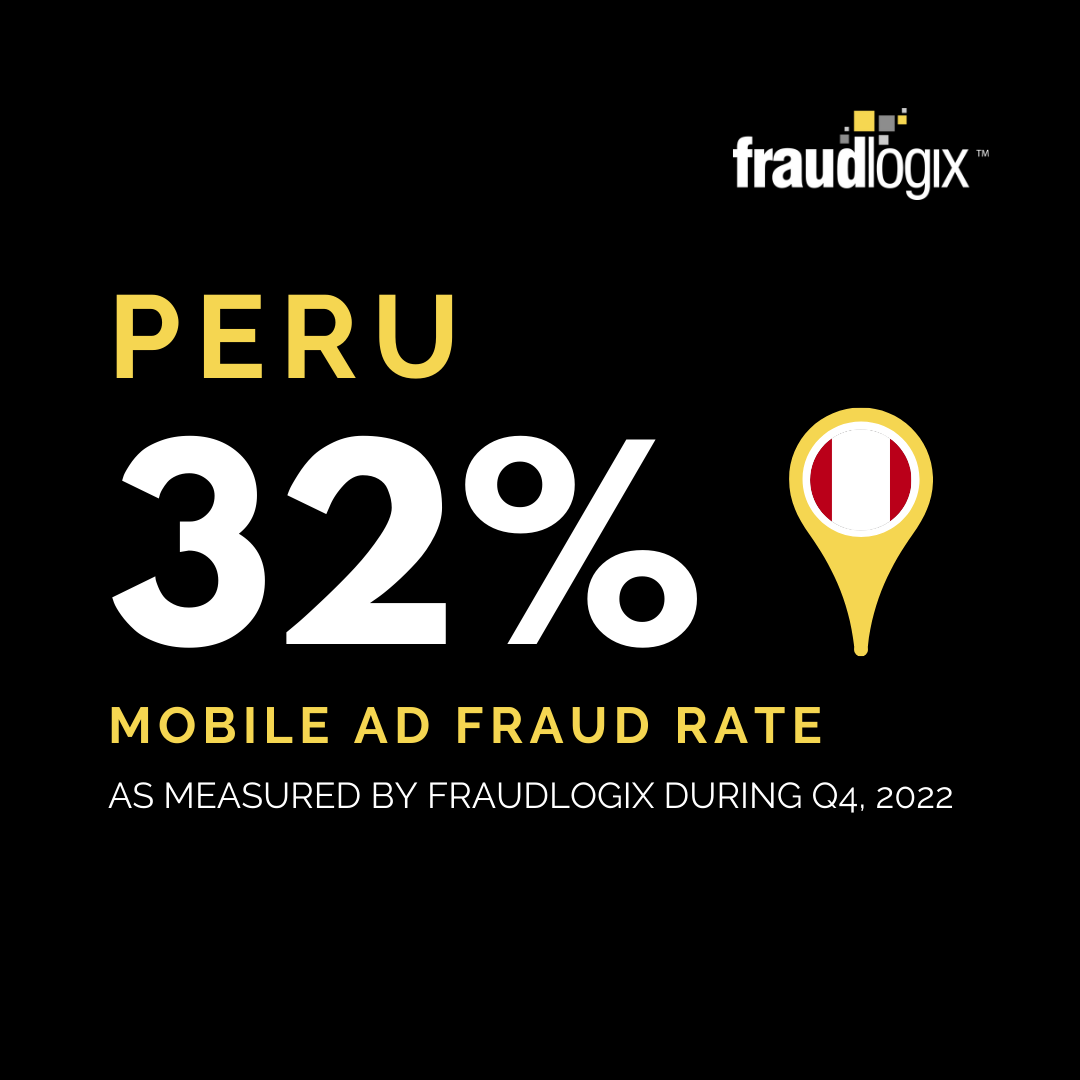
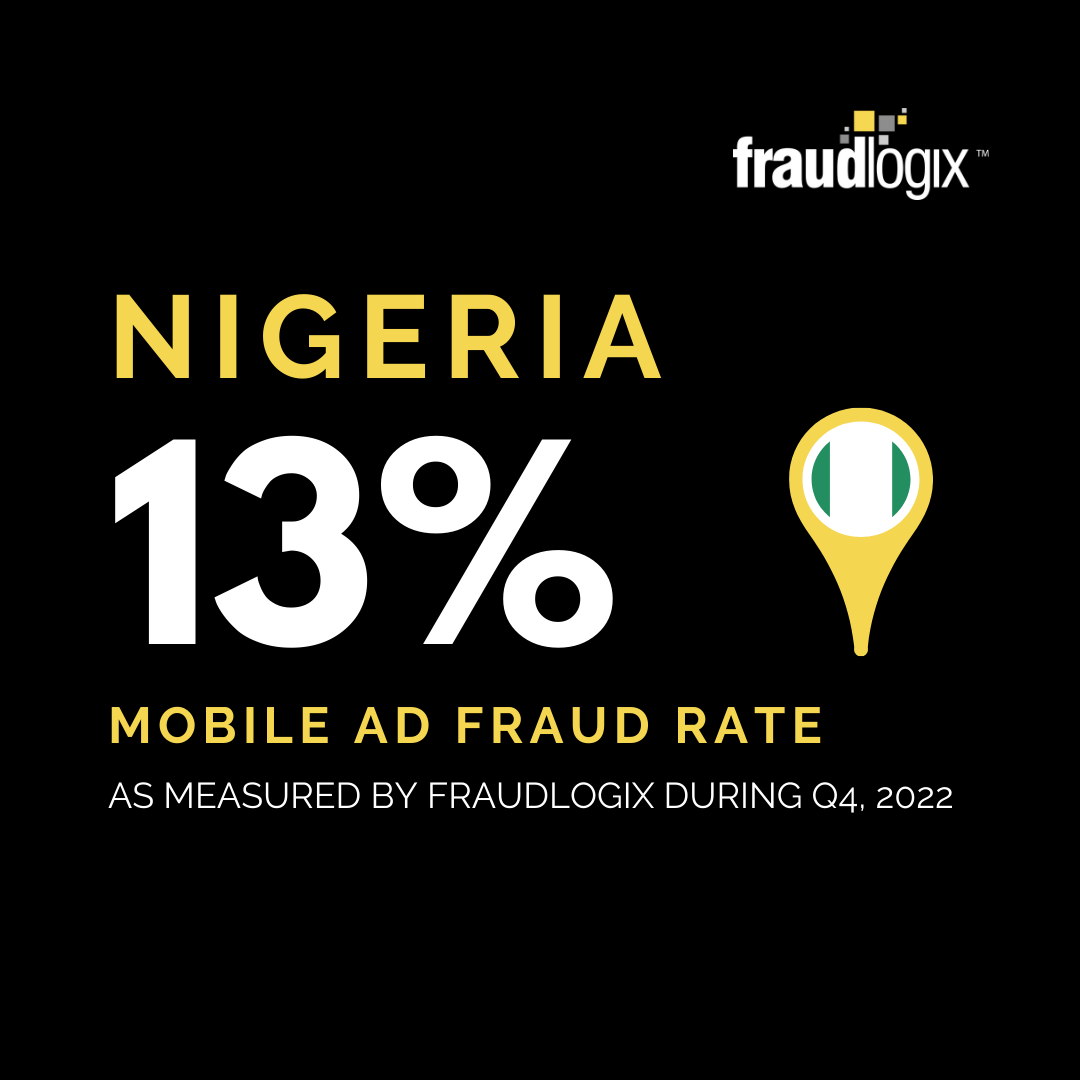
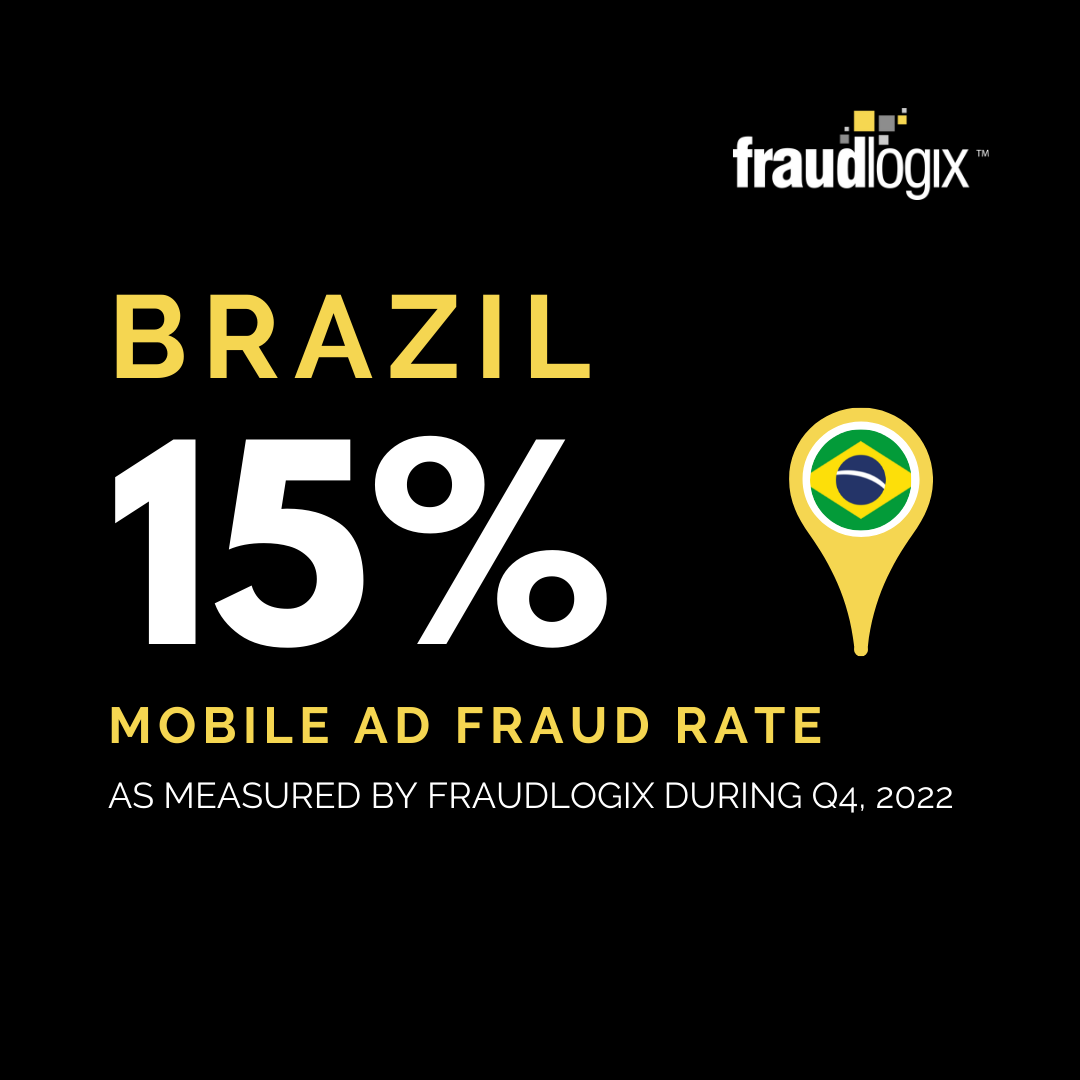
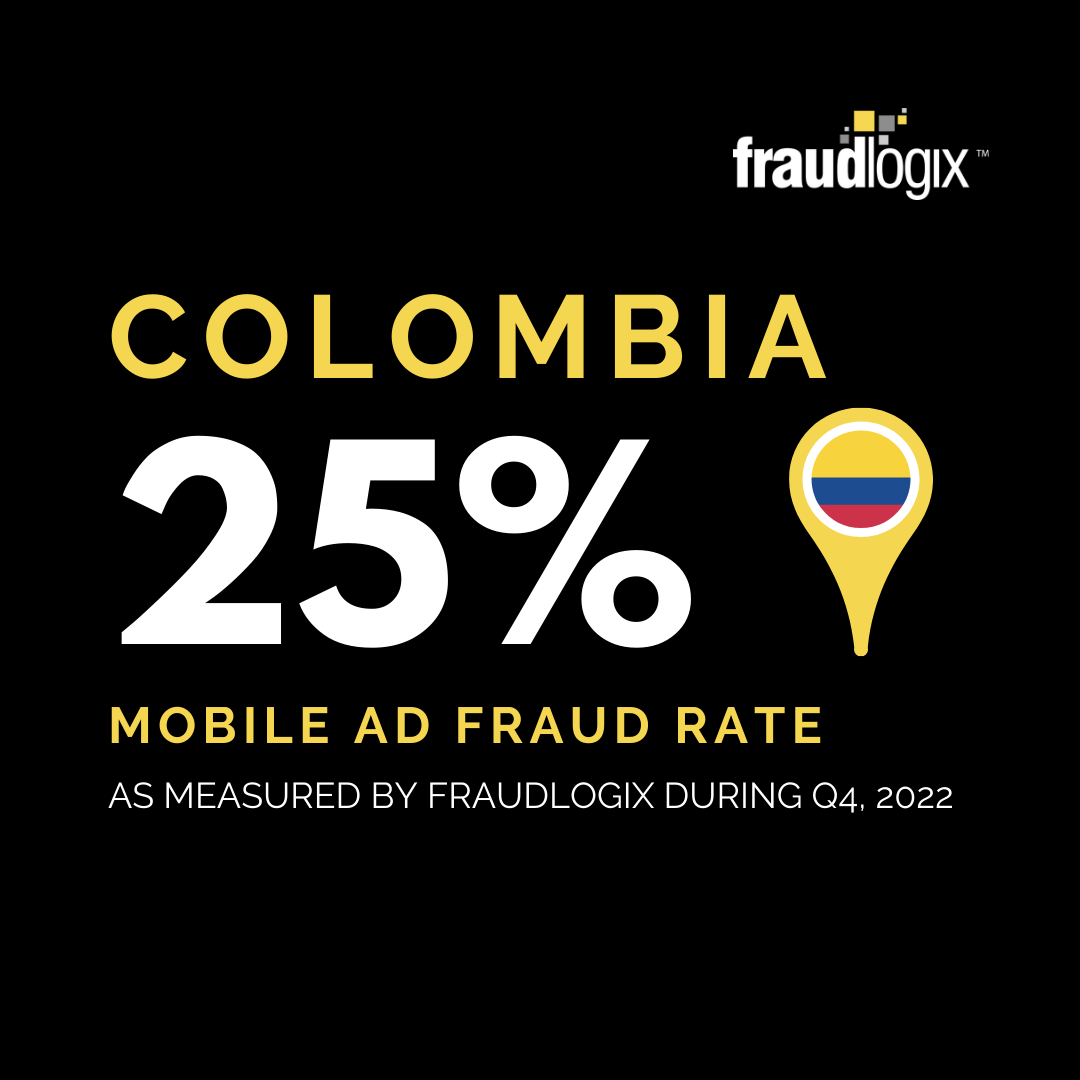
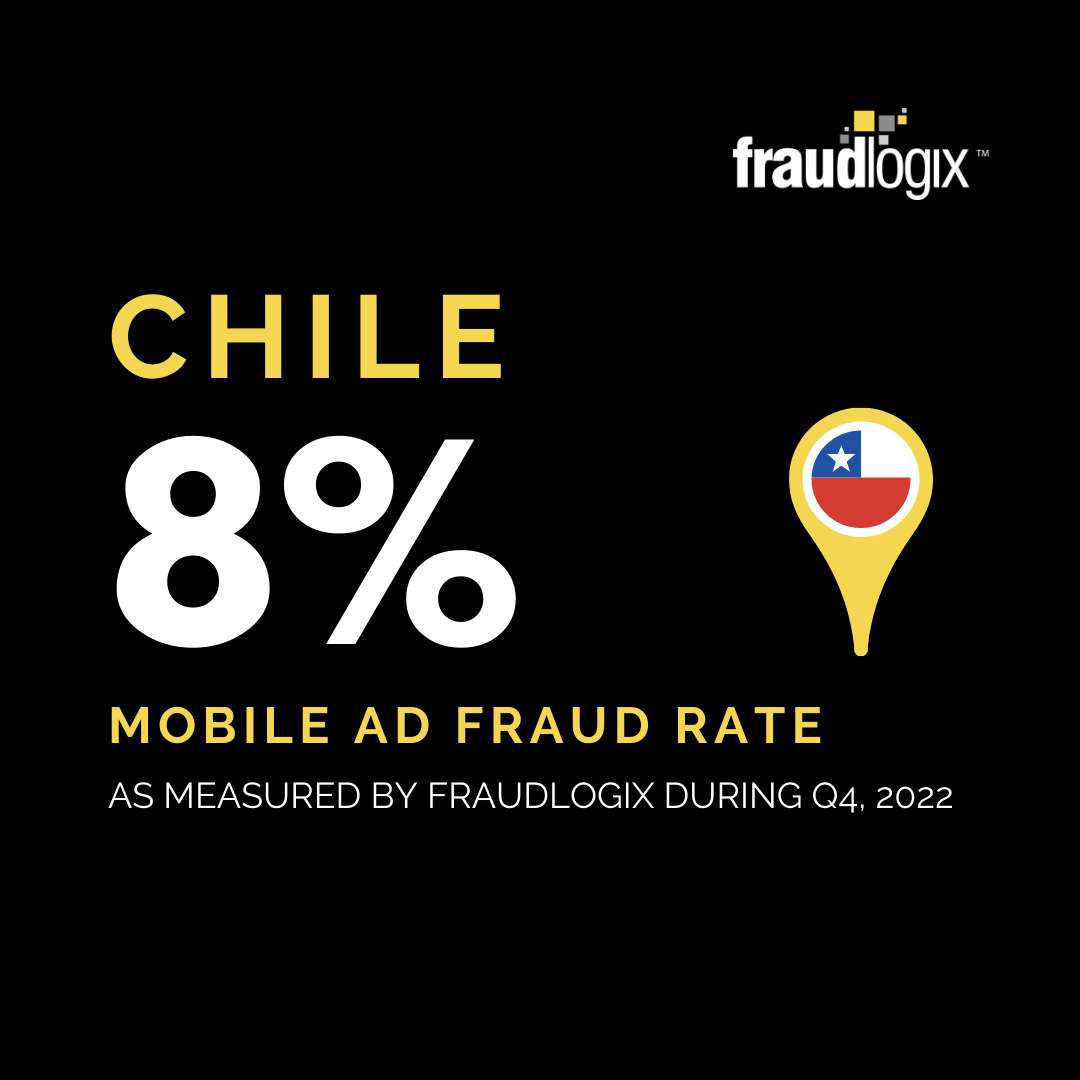
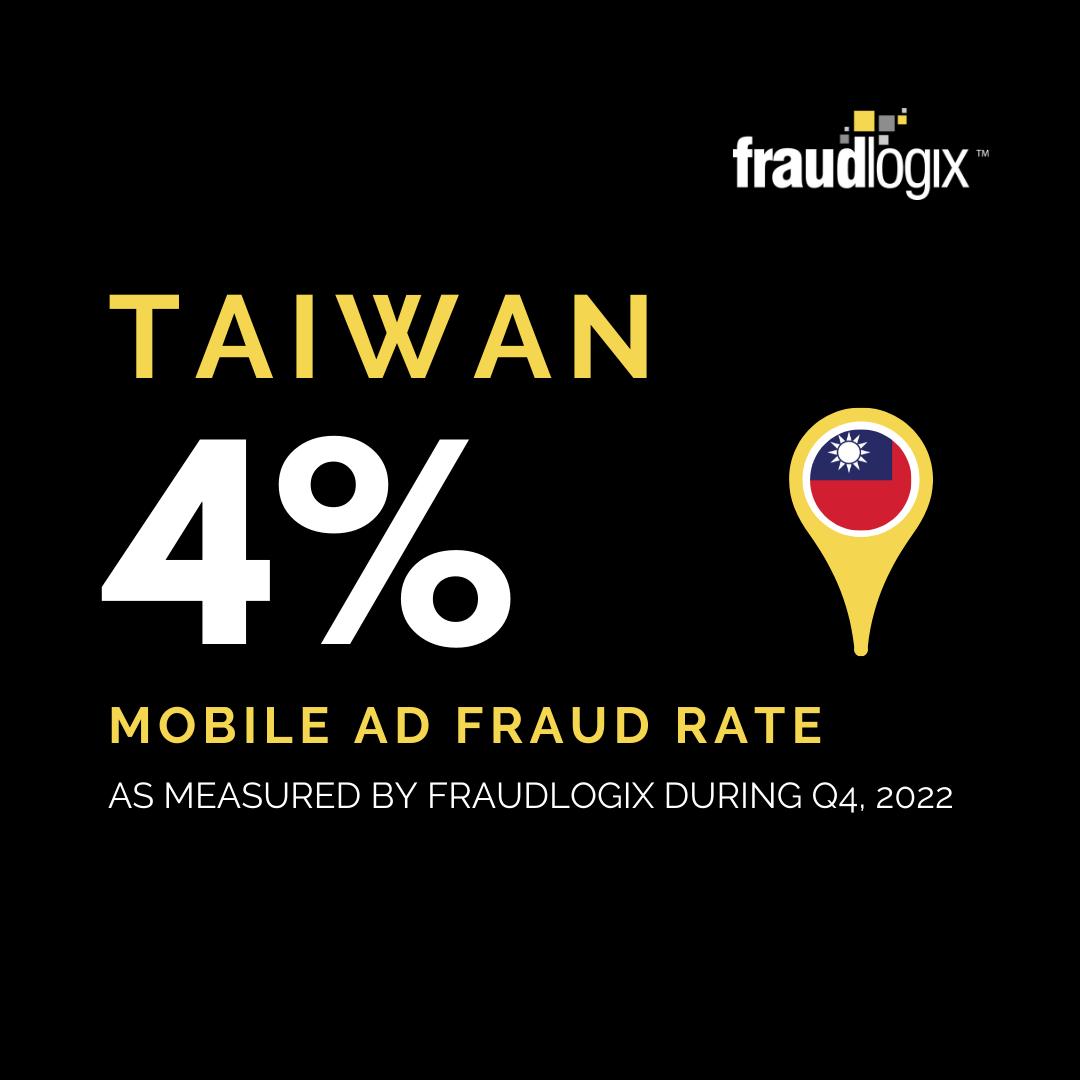
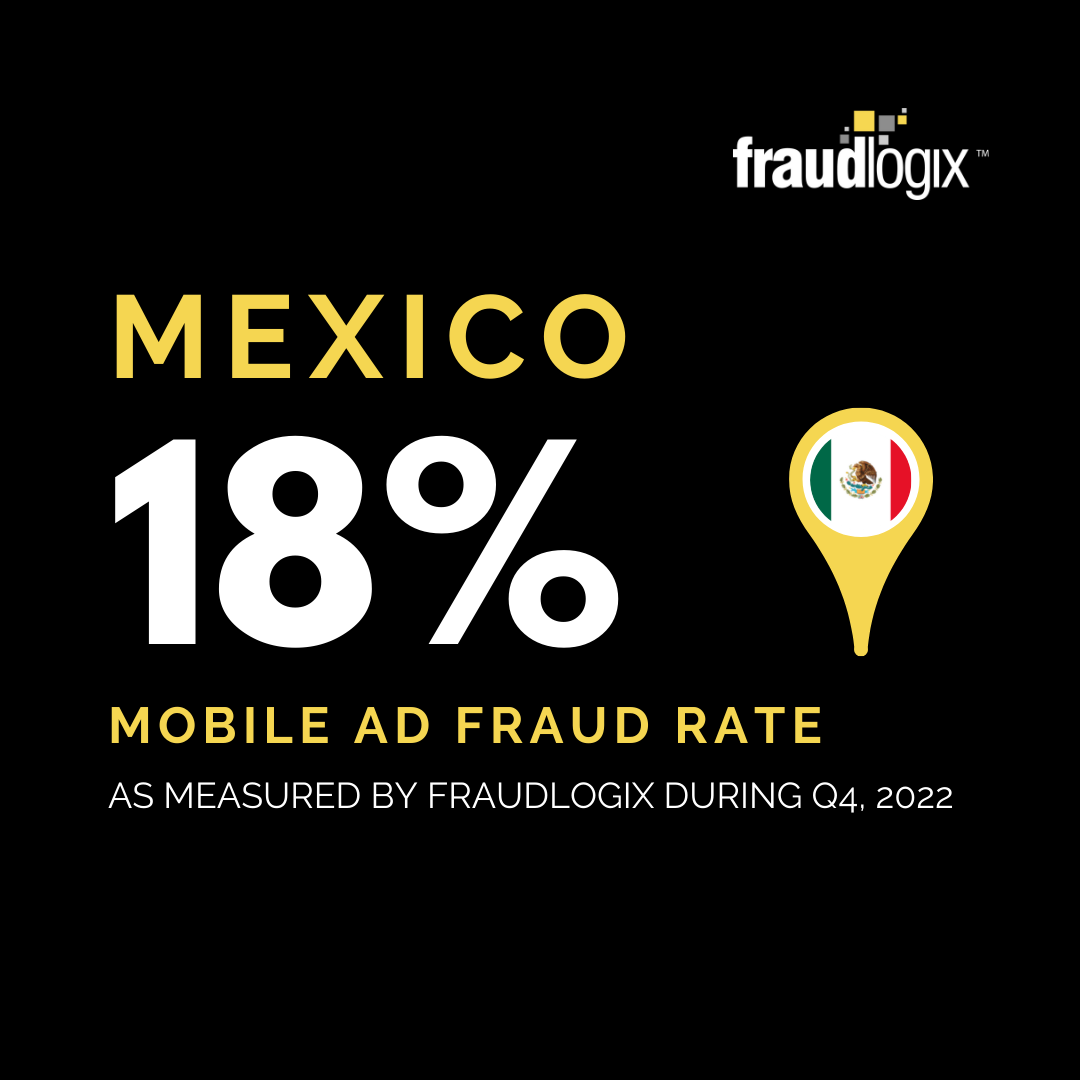
Mobile Ad Fraud by Country
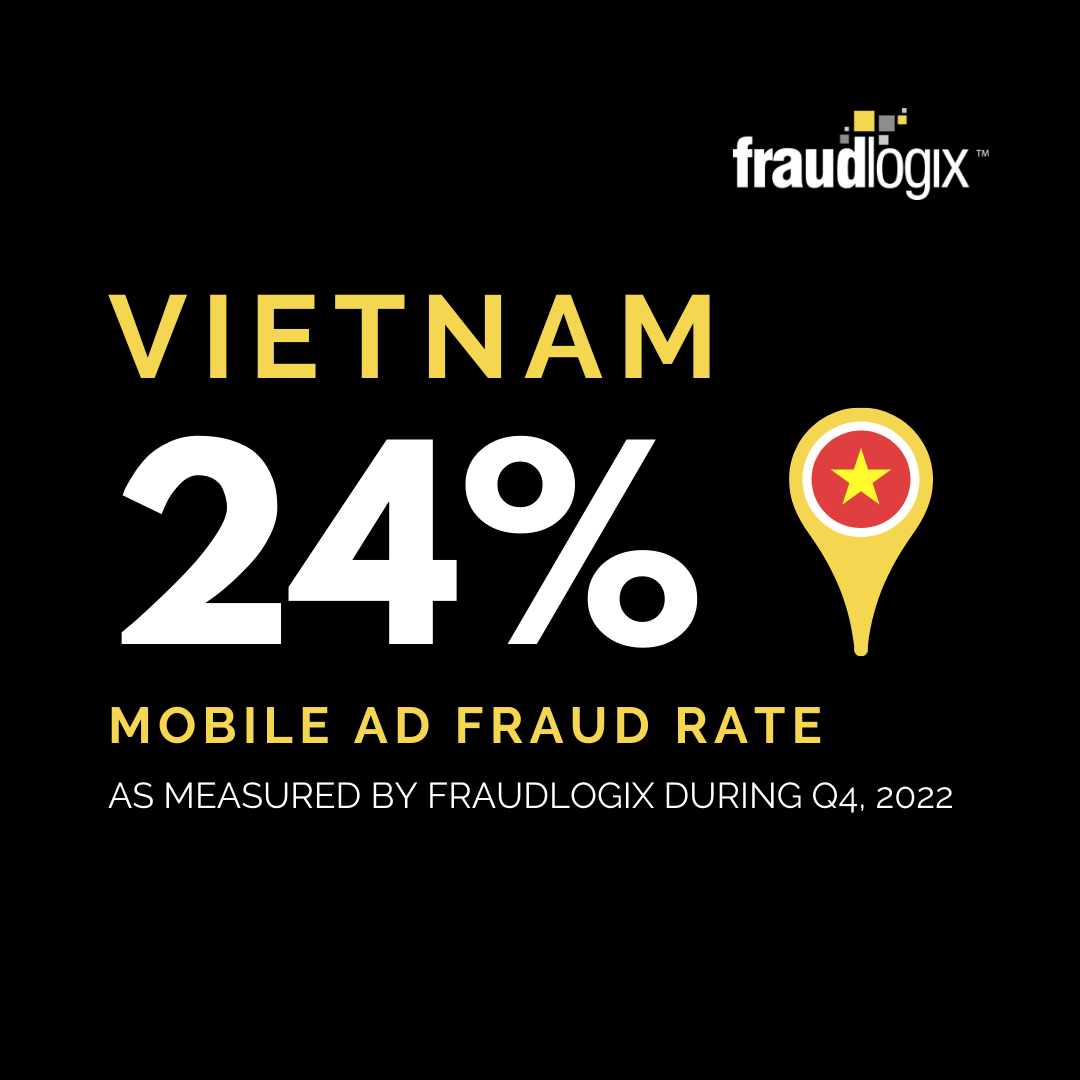
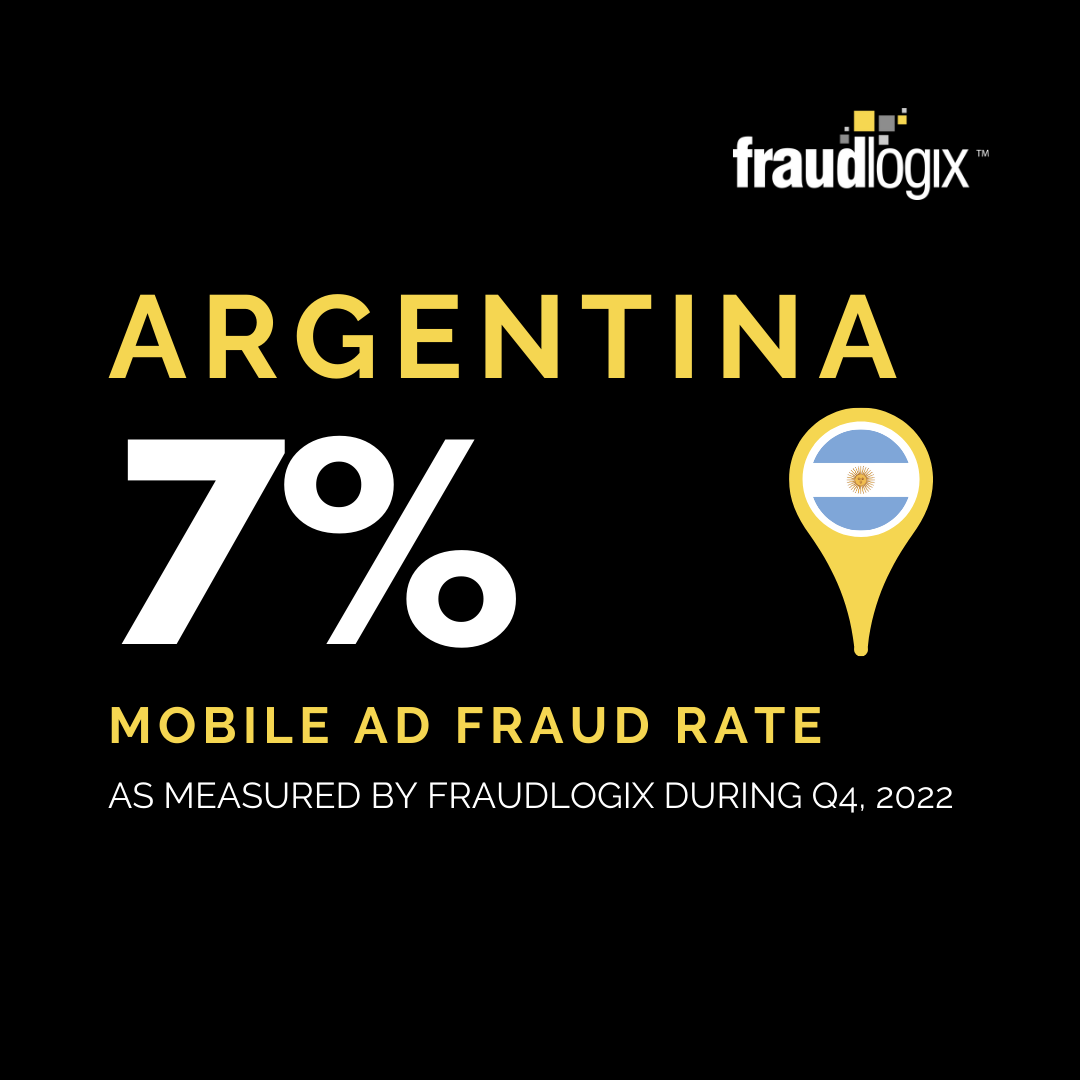
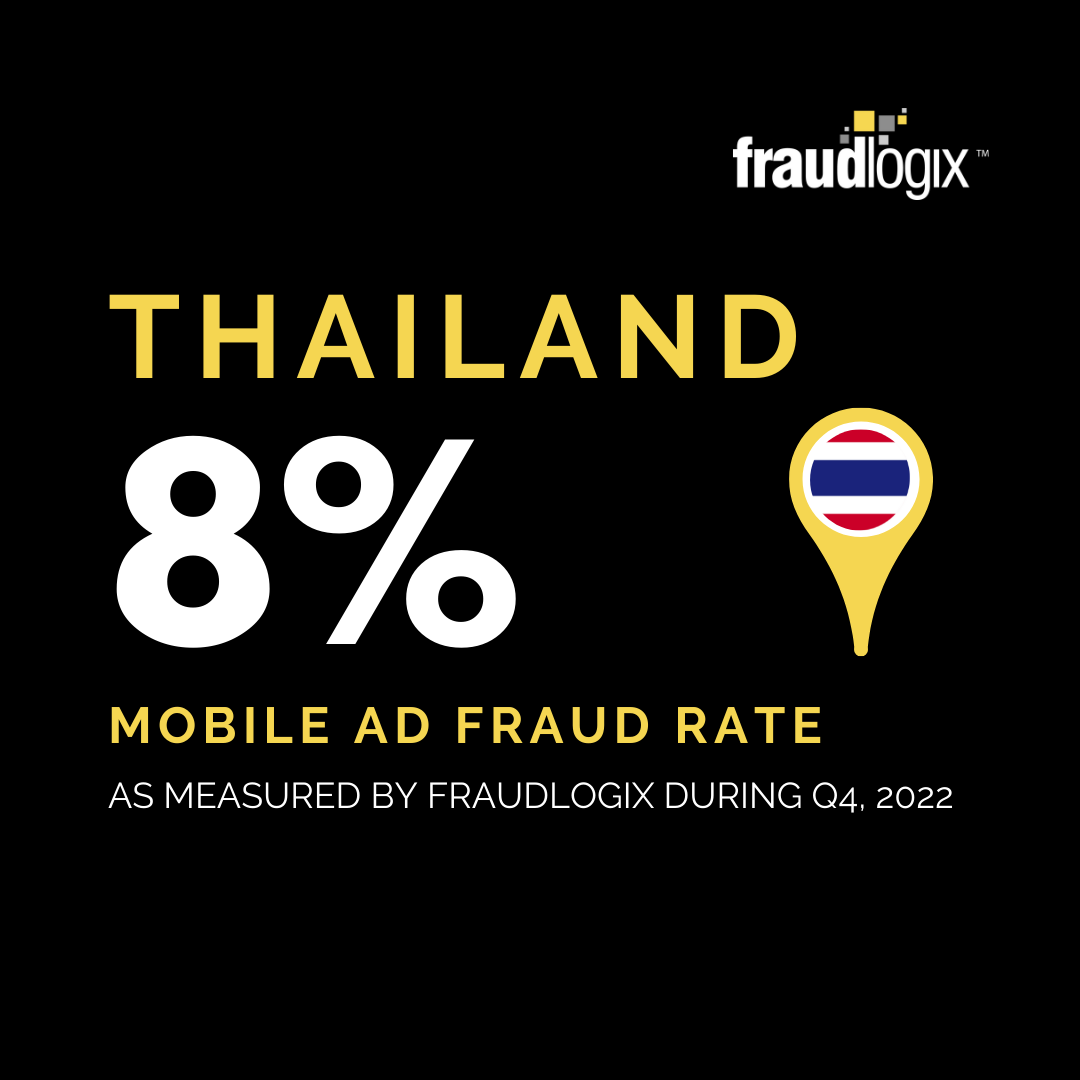
")