Data-Driven
Fraudlogix conducts and participates in ongoing research designed to enhance the global effort to stop bots.
")
Bot & Ad Fraud Statistics
Each quarter, Fraudlogix provides research through global monitoring of billions of ad requests monthly.
Managed DSP sees 56% Conversion Increase
Results of this case study indicate that dollar for dollar spent, the sites scored by Fraudlogix as “premium” performed 27x better than the non-premium sites. In a post campaign analysis, 64% of the campaign budget was spent on sites that generated 98% of conversions.
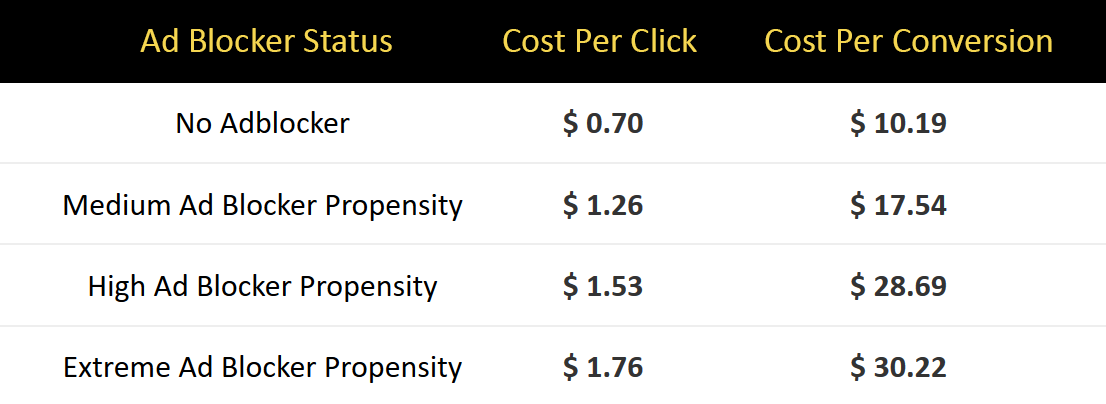
Ad Blocker Impact Study
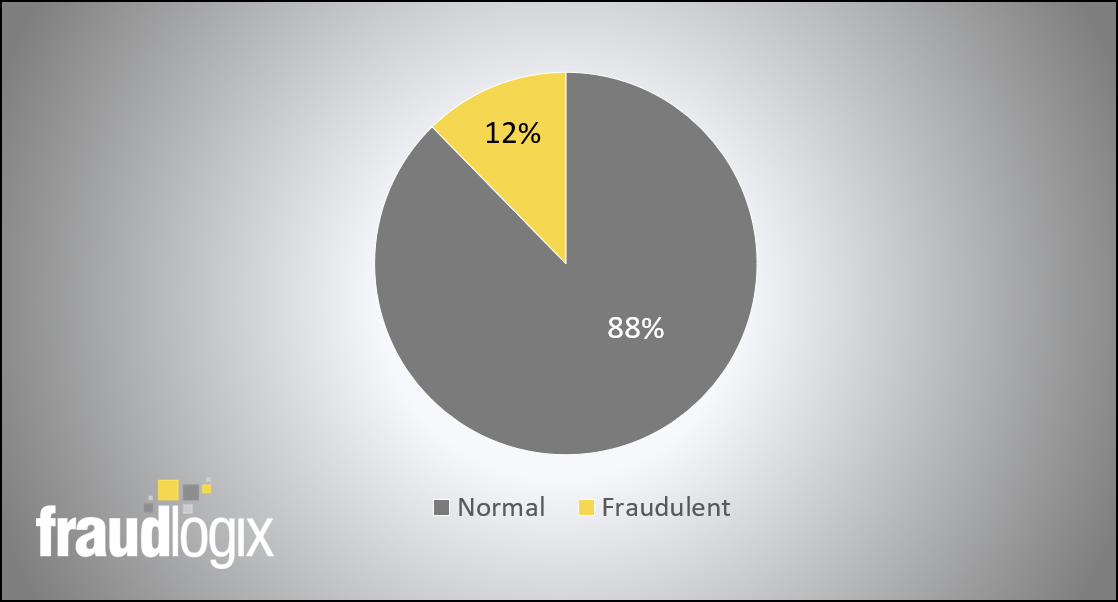
Ad blockers often fail and when they do, advertisers waste an average of 11.5% of their desktop budgets (3% mobile) serving ads to users with a dislike for ads.
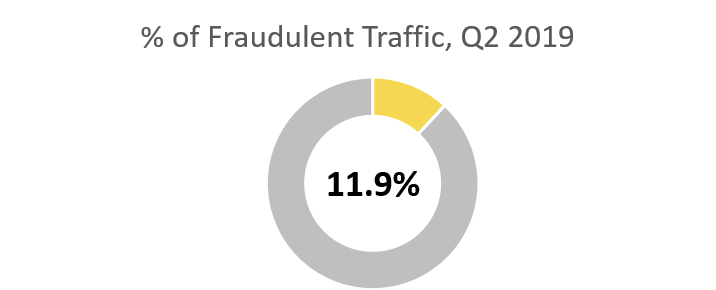
Q2 2019 Ad Fraud Report
In this report we looked at data from the second quarter of 2019. It’s part of our ongoing effort to track ad fraud across devices, browsers, operating systems and global regions.
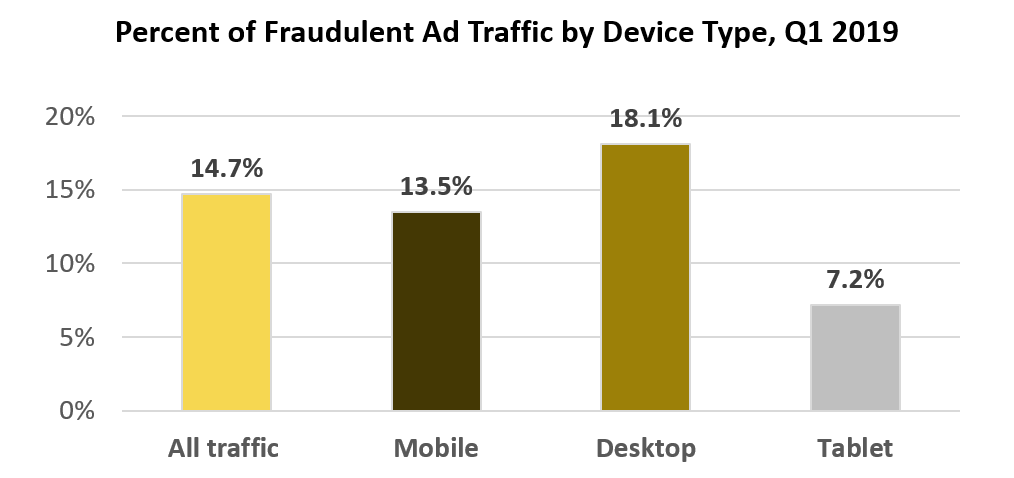
Q1 2019 Ad Fraud Report
In the Q1, 2019 Ad Fraud Report, we looked at data from the first quarter of 2019. It’s part of our ongoing effort to track ad fraud across devices, browsers, operating systems and global regions.
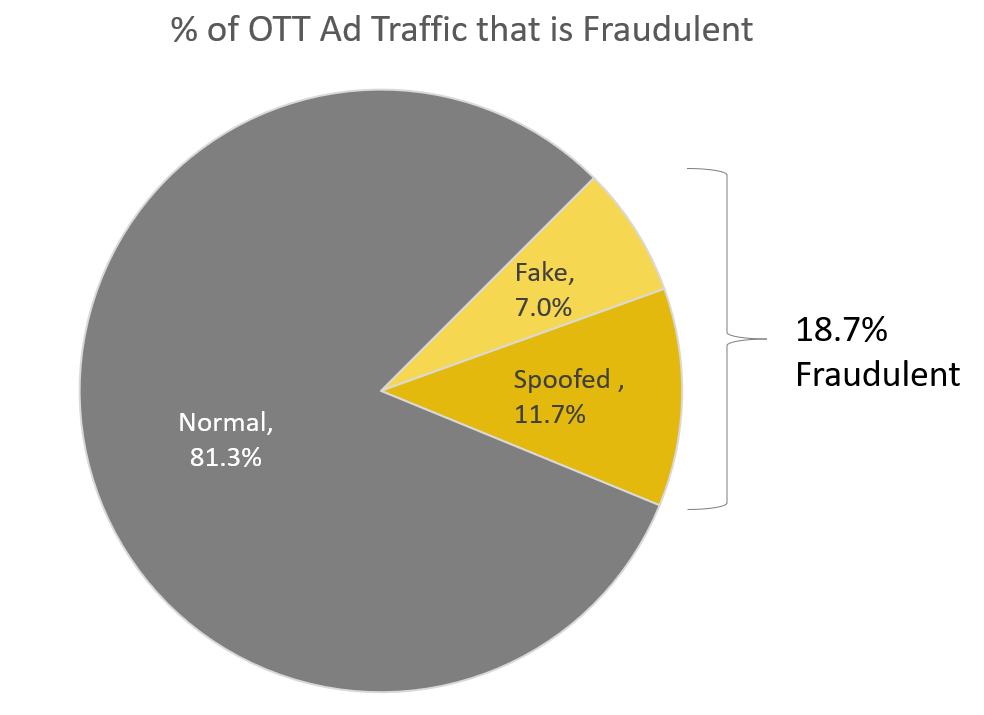
OTT Ad Fraud Report
In the OTT Ad Fraud Report, we looked at data from April 2019 to determine how much fraud is in the OTT space and what areas of the world it’s coming from.
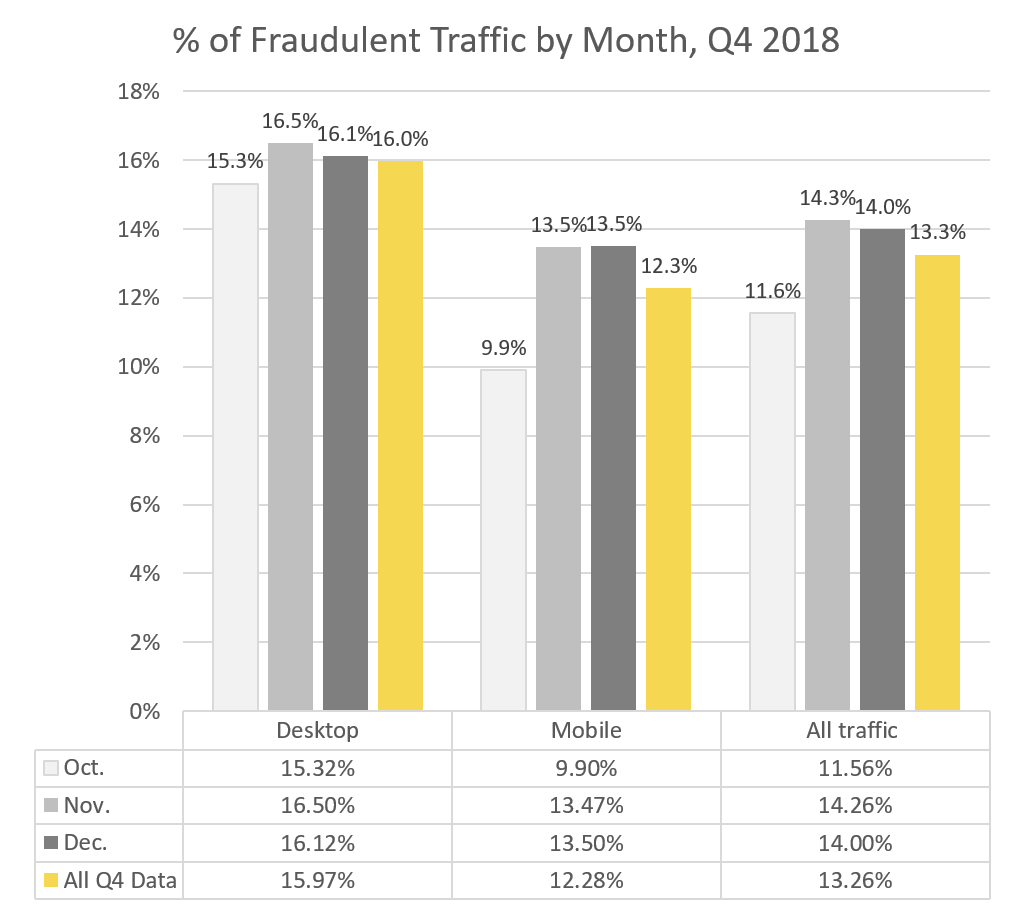
Q4 2018 Ad Fraud Report
In the Q4 2018 Ad Fraud Report, we combined data from October, November and December to create a larger picture of ad fraud in terms of which devices, browsers and operating systems are being used most and how much it’s affecting different global regions.
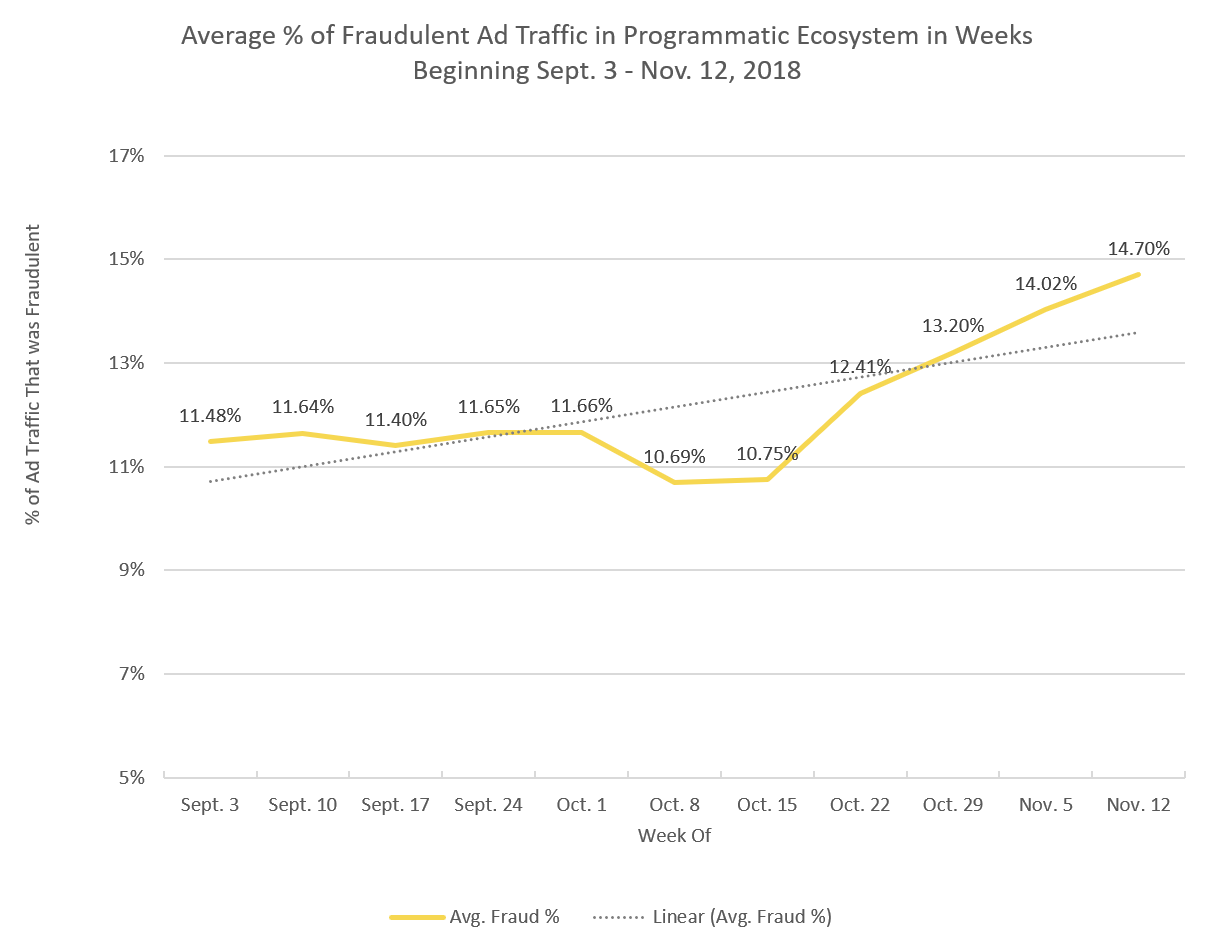
Ad Fraud Ramps Up Ahead of the Holidays: Four Ways Marketers Can Avoid It Now
Fraudlogix analyzed three months of programmatic ad traffic and found that in the weeks leading up to the busiest shopping season of the year, fraudulent ad traffic increased by more than 20 percent.
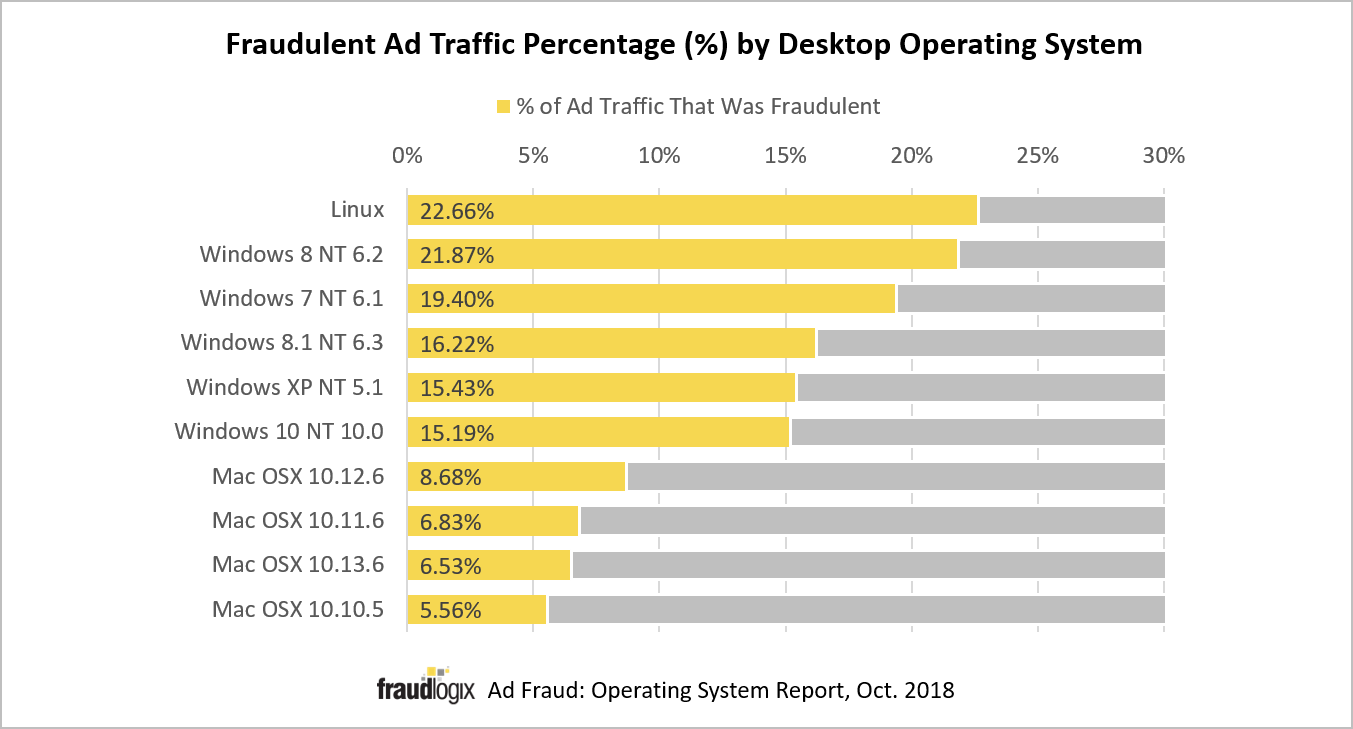
In Ad Fraud Fight, 17 Percent of Windows OS Traffic is Fraudulent
This report includes the percentages of fraud found in digital advertising traffic during the months of September and October 2018, broken down by desktop and mobile operating systems.

Chrome Browsers Dominate; 14% of Ad Traffic From Them is Fraudulent
This report includes the percentages of fraud found in digital advertising traffic during the month of September 2018, broken down by browser.
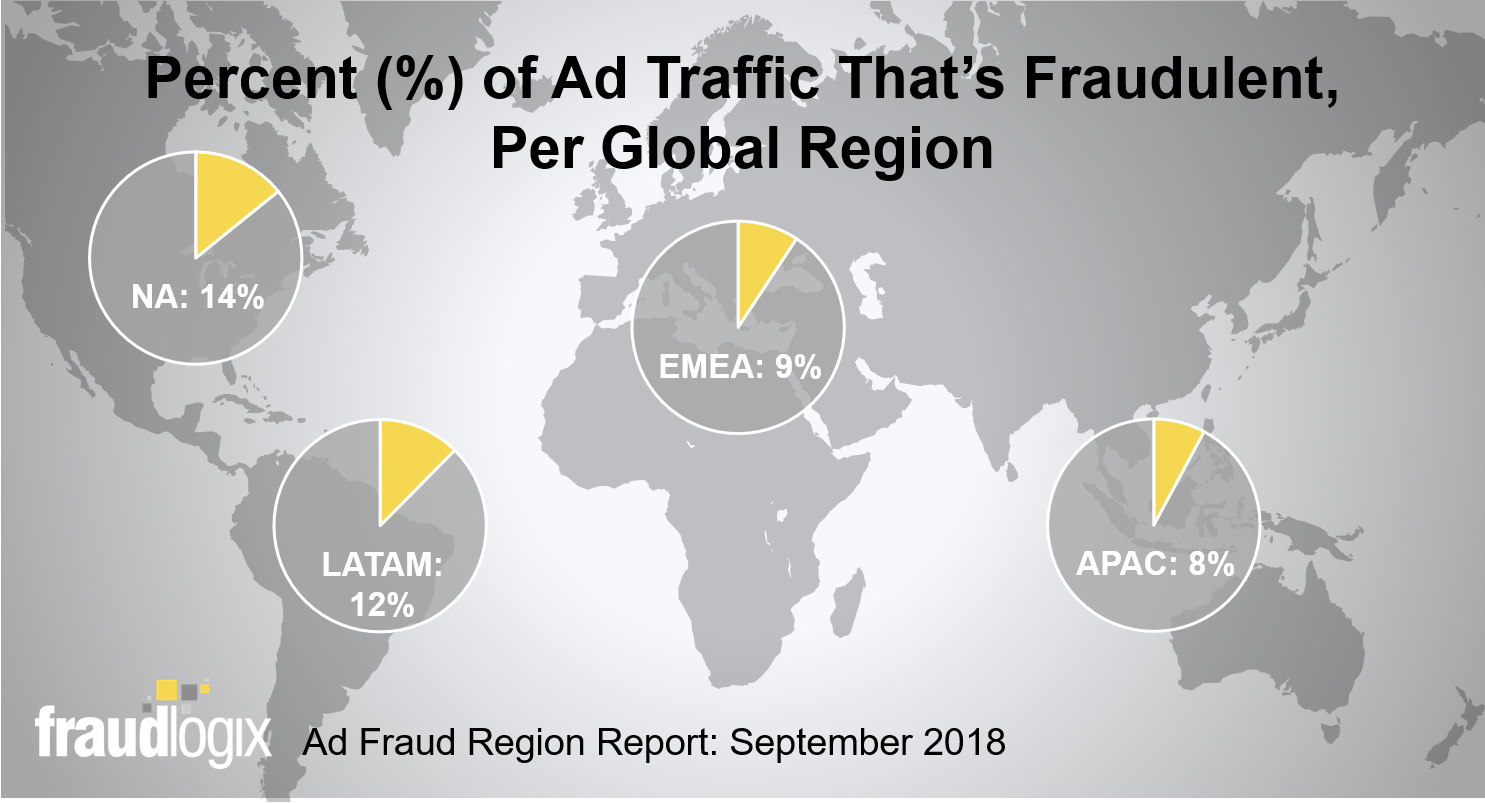
North American Region has Highest Percentage of Fraudulent Traffic, LATAM Leads in Mobile
This report includes the percentages of fraud found in digital advertising traffic during the month of September 2018, broken down into four major regional areas: APAC, EMEA, LATAM, and North America.