Fraudlogix Research · Holiday Season Report
Holiday ad fraud jumped 30% last season
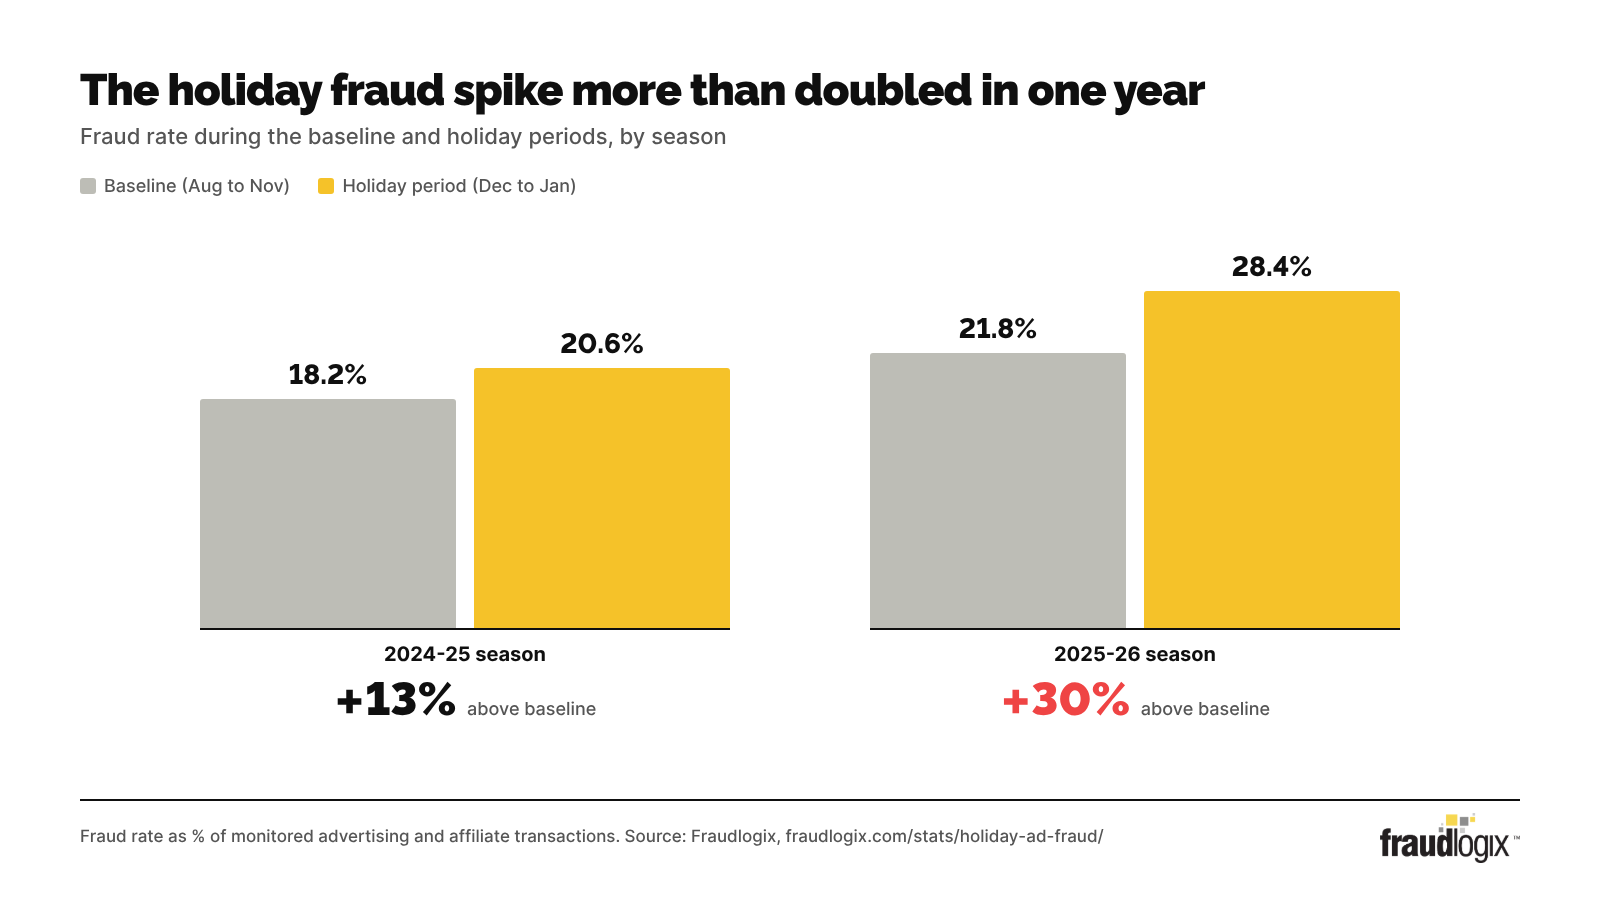
The December to January fraud spike more than doubled in one year, from 13% to 30% above baseline.
Key numbers
Free to use with attribution to Fraudlogix. Each button copies the stat with its source.
Holiday ad fraud rose 30% above its pre-holiday baseline in the 2025-26 season, up from 13% the year before, according to Fraudlogix.
28.4% of advertising and affiliate transactions were fraudulent during the 2025-26 holiday period, December to January, according to Fraudlogix.
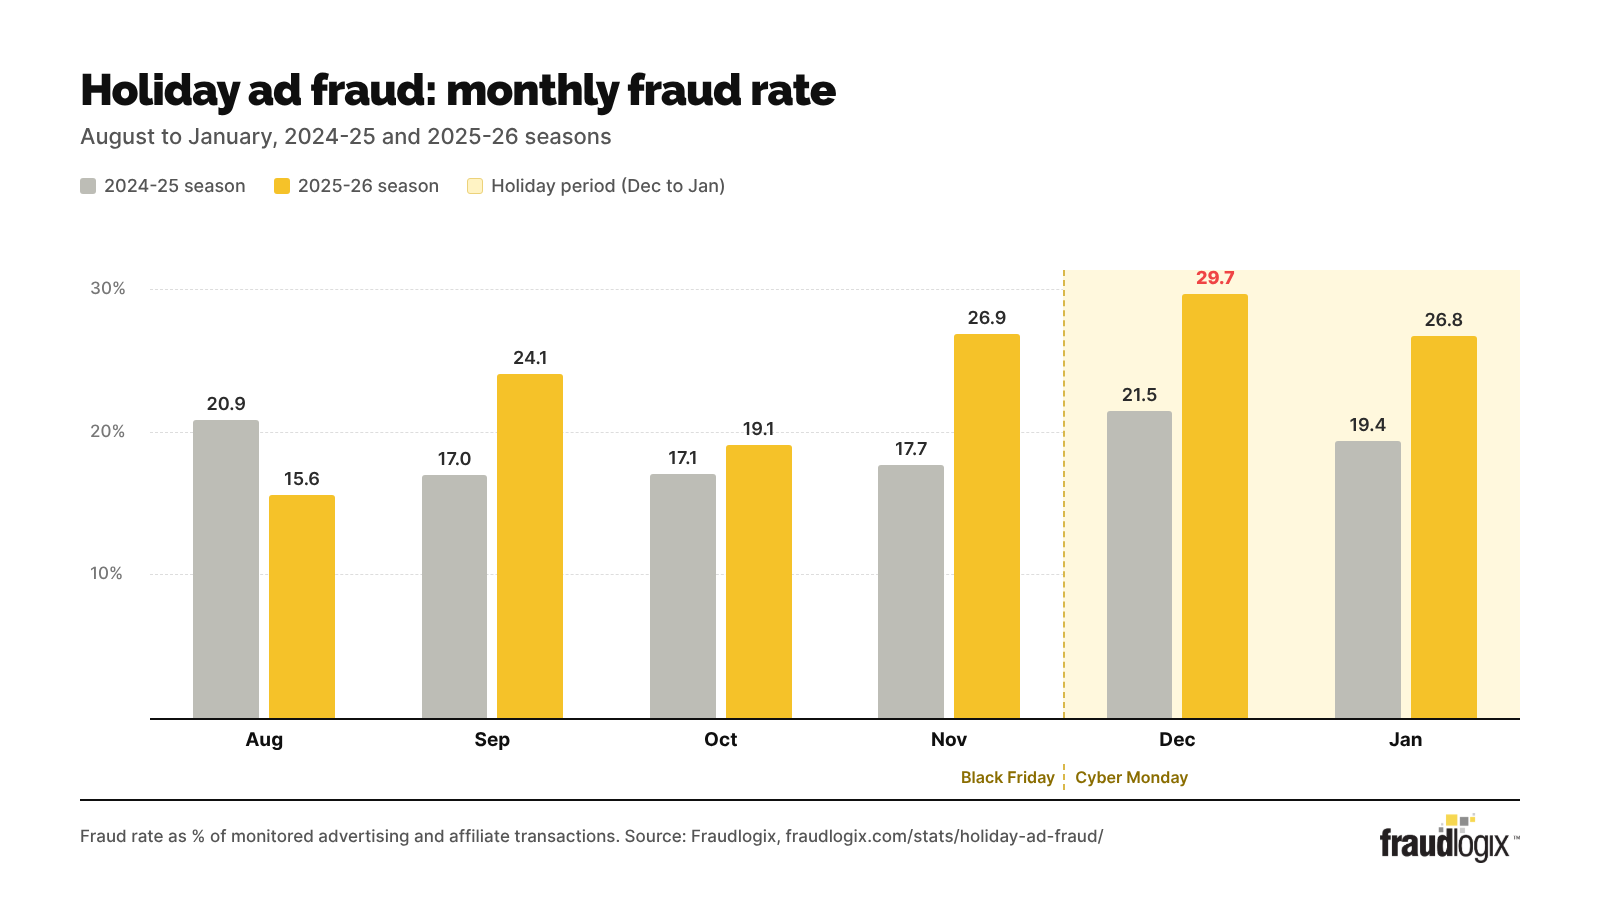
December 2025 had the highest monthly fraud rate in the Fraudlogix holiday dataset, at 29.7%.
Fraudlogix recorded approximately 96.6 million fraudulent transactions per day in December 2025, during peak holiday spending.
“Fraudsters plan for the holidays the same way retailers do. When payouts go up and review teams thin out, bad traffic moves in, and last season the spike was more than twice as large as the year before. Networks and advertisers should plan for this December to be worse and tighten their controls now, not after the chargebacks arrive in January.”
How much does ad fraud increase during the holidays?
According to Fraudlogix, fraud in digital advertising and affiliate traffic rose 30% during the 2025-26 holiday season. The fraud rate went from 21.8% in the August to November baseline to 28.4% in December and January. A year earlier, the same measurement showed a 13% rise, from 18.2% to 20.6%.
| Season | Baseline (Aug to Nov) | Holiday (Dec to Jan) | Increase from baseline |
|---|---|---|---|
| 2024-25 | 18.2% | 20.6% | +13% |
| 2025-26 | 21.8% | 28.4% | +30% |
Increase is relative to the baseline rate, not percentage points. Source: Fraudlogix.
Is holiday ad fraud getting worse?
Yes. The holiday spike more than doubled in one year, from 13% to 30% above baseline, and the holiday fraud rate climbed 7.8 percentage points, from 20.6% to 28.4%.
The baseline went up as well, from 18.2% to 21.8%, so fraud was already higher before the holidays began. The holiday surge on top of it was also larger. The acceleration suggests bad actors and fraudulent affiliates are targeting the holiday window more aggressively each year.
Outlook for 2026-27 (projection)
If the trend of the last two seasons holds, Fraudlogix projects the 2026-27 holiday spike could approach or exceed 50% above baseline. This is a projection, not measured data.
Fraudlogix has tracked holiday fraud since at least 2018, when its holiday analysis found fraudulent ad traffic rising from 11.6% in October to 14.2% in the first three weeks of November. That was a different dataset and time window, but it also showed fraud rising as the holidays approached.
Which month has the highest ad fraud rate?
December. It had the highest fraud rate in both seasons Fraudlogix measured: 21.5% in December 2024 and 29.7% in December 2025. In both seasons, fraud eased in January but stayed above the baseline rate. December 2025 also had the highest daily fraud volume in the dataset, roughly 96.6 million fraudulent transactions per day.
Fraud rate as % of monitored advertising and affiliate transactions. Black Friday fell on Nov 29, 2024 and Nov 28, 2025; Cyber Monday fell on Dec 2, 2024 and Dec 1, 2025. Source: Fraudlogix.
| Month | 2024-25 | 2025-26 | Period |
|---|---|---|---|
| August | 20.9% | 15.6% | Baseline |
| September | 17.0% | 24.1% | Baseline |
| October | 17.1% | 19.1% | Baseline |
| November | 17.7% | 26.9% | Baseline |
| December | 21.5% | 29.7% | Holiday |
| January | 19.4% | 26.8% | Holiday |
Source: Fraudlogix.
What about Black Friday?
Black Friday falls in November, which counts as part of the baseline period in this analysis. Cyber Monday fell in December both years, inside the holiday period. November fraud reached 26.9% in 2025, up from 17.7% in November 2024, so the 30% spike in 2025-26 was measured against a baseline that already included an elevated November.
Why does fraud spike during the holiday season?
Holiday fraud pays more and is harder to catch. For fraudulent affiliates and bot operators, the holiday surge is economically rational.
- Higher payouts per conversion
- Advertisers raise CPA rates and add bonuses on holiday offers, so each fake lead or sale earns more.
- Volume provides cover
- Legitimate clicks and conversions surge during the holidays, which makes fraudulent sub-affiliates harder to spot in real time.
- Less compliance oversight
- Fewer affiliate managers and compliance staff are scrubbing traffic and reviewing conversions over the holidays.
- Year-end budget pressure
- Use-it-or-lose-it Q4 budgets keep offers live and caps high, even on placements with questionable traffic.
The jump from 13% to 30% suggests fraud rings are putting more resources into holiday campaigns, including new publisher accounts, fresh bot networks, and high-payout verticals such as ecommerce, financial services, and subscription offers. As long as holiday EPC stays elevated and network compliance stays relaxed during peak season, the trend is unlikely to reverse on its own.
Who is affected by holiday ad fraud?
Networks, advertisers, and publishers all pay for it. Networks absorb chargebacks in Q1, and advertisers pay for conversions that never become customers. Honest publishers lose income when offers are paused or scrubbed harder. If 28% of holiday conversions are fraudulent, true CPA is significantly higher than reported CPA.
Affiliate networks
Advertisers claw back fraudulent holiday conversions in January and February, after networks have already paid affiliates. Repeated holiday fraud also pushes advertisers to cut budgets, lower caps, or leave a network entirely.
Advertisers
Fake leads and sales use up budget without producing real customers or lifetime value. They also distort attribution, media mix models, and ROAS reporting.
Publishers and legitimate affiliates
Networks scrub harder in high-fraud periods and catch real conversions too. Payments take longer, and offers get paused or capped mid-campaign, cutting off revenue for clean traffic.
How can networks and advertisers prepare for holiday ad fraud?
Expect fraud to rise meaningfully above your normal rate in December and January, and build that into offer economics before Q1 chargebacks arrive. Fraudlogix recommends five steps.
- Tighten affiliate approvals before the rush. Vet new publishers and sub-affiliate sources now, and avoid onboarding unproven traffic during peak fraud season.
- Cap high-payout offers. Set tighter caps and conversion limits. Uncapped holiday offers attract fraud.
- Watch sub-IDs and click-to-conversion patterns in real time. Abnormal click volume, very fast conversions, and geographic mismatches are early signs.
- Plan for fraud above your baseline. Whatever your normal rate is, build a meaningful holiday increase into payouts.
- Verify traffic surges. Not every holiday spike is real shoppers. Check the traffic before scaling payouts or raising caps.
How was this data collected?
This report uses a sample of 98.3 billion digital advertising and affiliate transactions from the Fraudlogix real-time fraud detection platform, covering two holiday seasons. Each transaction was classified when it happened, using device fingerprinting, behavioral analysis, network intelligence, and pattern recognition, rather than in a later audit.
| Data source | Fraudlogix real-time fraud detection platform |
| Transaction types | Digital advertising and affiliate transactions on CPA, CPL, CPC, and revenue share offers |
| Baseline period | August through November, the 4 months before the holiday period |
| Holiday period | December through January, the peak holiday spending window |
| Coverage | Mobile app, mobile web, and desktop, across CPA networks, affiliate programs, and direct advertiser-publisher relationships |
| Fraud rate | Share of monitored transactions classified as fraudulent |
| Season | Baseline (Aug to Nov) | Holiday (Dec to Jan) | Season total |
|---|---|---|---|
| 2024-25 | 25.8 billion | 14.9 billion | 40.7 billion |
| 2025-26 | 39.5 billion | 18.1 billion | 57.6 billion |
| Total | 65.3 billion | 33.0 billion | 98.3 billion |
This dataset measures advertising and affiliate transactions. It is separate from the impression-based invalid traffic rates in the Fraudlogix ad fraud statistics report, so the two are not directly comparable.
For journalists and analysts
Media kit
You can use any statistic or chart on this page with attribution to Fraudlogix and a link to this page. For interviews, comment, or data requests, contact Kristin Hood.
Suggested citation
Fraudlogix, “Holiday Ad Fraud Statistics,” November 2026, https://www.fraudlogix.com/stats/holiday-ad-fraud/
Media contact
Kristin Hood
Send a media inquiry or data request
Fraudlogix in the news
Spokesperson
Jessica Lopez, Co-Founder and COO
Frequently asked questions
How much does ad fraud increase during the holidays?
In the 2025-26 season, Fraudlogix measured a 30% increase in fraud during December and January compared with the August to November baseline. The fraud rate rose from 21.8% to 28.4%. In 2024-25, the increase was 13%.
What month has the most ad fraud?
December. It was the highest-fraud month in both seasons Fraudlogix analyzed, at 21.5% in December 2024 and 29.7% in December 2025.
Is affiliate fraud higher during the holidays?
Fraudlogix data points that way. The holiday dataset combines digital advertising and affiliate transactions on CPA, CPL, CPC, and revenue share offers, and it does not break out affiliate traffic on its own. Higher holiday payouts, heavy traffic, and reduced compliance staffing make the season attractive to fraudulent affiliates.
Will holiday ad fraud be worse in 2026-27?
It may be. This is a projection, not measured data: if the trend from the last two seasons continues, Fraudlogix projects the 2026-27 holiday spike could approach or exceed 50% above baseline.
How is this different from the Fraudlogix global IVT rate?
The global invalid traffic (IVT) rate measures ad impressions. This holiday report measures advertising and affiliate transactions, a separate dataset, so the two rates should not be compared directly.
Can I cite these statistics?
Yes. Please attribute the data to Fraudlogix and link to this page.
Check holiday traffic before you pay out
The IP Risk Score API scores the IP address behind each click, lead, or conversion in real time, with the first 1,000 lookups each month free. For blocking at scale, the IP Blocklist covers 40M+ flagged IPs and updates every hour.